
The Ultimate Innovation Portfolio Report Template: Turning Data into Action12 min read

Most innovation reports are destined for a desk drawer.
They’re often dense, backward-looking, and fail to lead to any clear decisions. As a result, leaders ignore them, and innovation teams feel misunderstood.
But let’s look at a different approach, with a simple, forward-looking template designed to create a report that leaders will actually read and act upon.
The First 5 Minutes: What Your Leaders See
The first page of your report is the most important.
It must deliver the main message in seconds. If you don’t capture a leader’s attention here, you’ve lost them.
The Action-Oriented Executive Summary
Don’t write a passive update. Your summary should be a direct request for a decision.
Frame it this way to get straight to the point:
- Look back: Briefly state your biggest wins and what you learned from any setbacks.
- Look ahead: Highlight the top opportunities your work can capture and the real risks you face.
- The ask: Clearly state the specific decision or resources you need from leadership right now.
This structure changes the conversation from “Here’s what we did” to “Here’s what we need to do next.”
It positions the innovation team as a strategic partner, not just a cost center., which makes it easier for leaders to engage and provide the specific support needed.
The One-Page Visual Dashboard
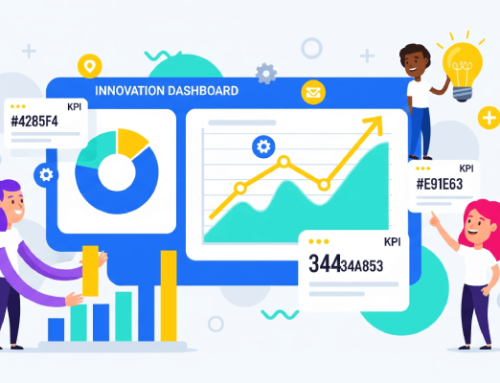
The dashboard is the visual proof for the story you tell in your summary. It should give a complete view of your portfolio’s health at a glance.
To avoid showing a skewed picture, use four types of metrics:
- Inputs: The resources you’re investing (e.g., budget, people).
- Process: How efficient your system is (e.g., idea-to-launch time).
- Outputs: The direct results of your work (e.g., prototypes, new products).
- Outcomes: The final business impact (e.g., revenue, market share).
Use simple charts and a clear Red/Amber/Green color code to show status. This visual shortcut saves valuable time during leadership reviews.
It allows anyone to understand a project’s health instantly, preventing key issues from getting lost in the details.
Visualizing Your Portfolio for Strategic Balance
Your portfolio shouldn’t be a random list of projects. It should be a balanced set of bets that supports the company’s strategy.
A Quick Guide to Key Frameworks
You don’t need complex tools.
These three views give you and your leadership team a clear, multi-dimensional picture of your innovation efforts.
- The Three Horizons: Manage projects for the short, medium, and long term
- Innovation Ambition Matrix: Map initiatives as Core, Adjacent, or Transformational
- Risk/Reward Matrix: Prioritize high-value “Pearls” and cut low-value “White Elephants”
Using these frameworks together gives you a complete and unbiased view of your portfolio and help you answer critical questions about balance, risk, and strategic fit.
This clear picture is essential for making objective decisions about where to invest resources.
The 70-20-10 Rule as a Starting Point
How should you allocate your resources?
A common guideline is the 70-20-10 rule:
- 70% of resources on Core projects
- 20% on Adjacent projects
- 10% on Transformational projects
This isn’t a strict rule, as a fast-moving tech company might need a riskier mix, while a more established company might focus more on the core.
State your target allocation in the report and show how your actual spending compares.
The Innovation Portfolio Report Template
Here is a complete, ready-to-use template. The goal is to be concise and clear. Fill in the brackets [ ] with your own data.
How to Use This Template
This template is designed to be filled out quickly.
Don’t write long paragraphs. Use bullet points and focus on the most important information. The goal is to create a document that can be understood in minutes.
The Full Report Template: Innovation Portfolio Report: [Quarter, Year]
Part 1: Executive Summary
- Look Back (What Happened):
- Key Wins: [List 1-2 major successes. e.g., “Launched Project Alpha, achieving 150% of Q1 user targets.”]
- Key Learnings: [List 1-2 setbacks framed as learnings. e.g., “Discovered through Project Beta that our target market will not pay for X, saving an estimated $200k in development costs.”]
- Look Ahead (What’s Next):
- Top Opportunities: [List 1-2 major opportunities the portfolio is positioned to capture.]
- Critical Risks: [List the 1-2 biggest risks to the portfolio’s success, e.g., “Resource bottleneck in the data science team.”]
- The Ask (Decision Needed):
- [State the 1-2 specific decisions you need. e.g., “Approval for an additional $75k to accelerate Project Gamma based on promising pilot results.”]
Part 2: The One-Page Dashboard
[Insert a simple visual dashboard here. It should contain a few key charts:]
- Portfolio Balance: A pie chart showing your 70-20-10 resource allocation.
- Pipeline Health: A funnel chart showing projects at each stage (e.g., Ideation, Validation, Scaling).
- Key Outcome Metric: A line graph showing % of revenue from new products over the last 4 quarters.
- Financials: A bar chart showing total portfolio budget vs. actual spend.
Part 3: Portfolio Analysis
- Three Horizons of Growth: [Insert bubble chart showing projects across H1, H2, H3. Bubble size can represent budget.]
- Risk/Reward Matrix: [Insert 2×2 matrix plotting all key projects. Clearly label the Pearls, Oysters, Bread & Butter, and White Elephants.]
Part 4: Key Project Summaries
(Repeat this summary for the 3-5 most important projects)
| Project Name: | [Project Name] | Strategic Goal: | [e.g., Increase Market Share] |
| Project Lead: | [Name] | Horizon: | [H1/H2/H3] |
| Stage: | [e.g., Validation] | Status: | [Green/Amber/Red] |
| Budget (YTD): | [$XXXk / $YYYk] |
Problem: [1-sentence summary of the customer problem.]
Solution: [1-sentence summary of the proposed solution.]
Validated Learnings (Last 90 Days):
- [Bulleted list of what you tested and learned. e.g., “Validated that customers will pre-pay for this feature.”]
Next Steps:
- [Bulleted list of key activities for the next 90 days.]
Sample Report: Innovation Portfolio Report: Q3 2025
Part 1: Executive Summary
- Look Back (What Happened):
- Key Wins: Launched ‘ConnectAI’ customer service bot, now successfully handling 15% of all inbound support queries and boosting customer satisfaction by 5 points.
- Key Learnings: The ‘Project Swift’ pilot proved our current logistics partners cannot support same-day delivery. This learning prevented a costly full-scale launch and is informing our new logistics strategy.
- Look Ahead (What’s Next):
- Top Opportunities: Early data from ‘ConnectAI’ shows strong interest from Small-to-Medium Businesses, a potential new $5M ARR market segment.
- Critical Risks: High turnover in the engineering team is causing significant delays for ‘Project Apollo’ and puts our Q1 2026 launch at risk.
- The Ask (Decision Needed):
- Approval for an emergency fund of $100k to hire two senior contract engineers for six months to get ‘Project Apollo’ back on schedule.
Part 2: The One-Page Dashboard
- Portfolio Balance: A pie chart shows our current resource allocation is 75% Core, 20% Adjacent, and 5% Transformational. We are under our 10% target for Transformational investment.
- Pipeline Health: A funnel chart displays the innovation pipeline: 25 new ideas entered this quarter, leading to 8 projects in the validation stage, and 3 projects now scaling. The conversion rate from idea to validation is 32%.
- Key Outcome Metric: A line graph tracks revenue from new products (launched in the last 3 years), showing an increase from 8% in Q2 to 11% in Q3, exceeding our 10% target.
- Financials: A bar chart compares the year-to-date budget of $1.8M against the actual spend of $1.7M. We are currently 5.5% under budget.
Part 3: Portfolio Analysis
- Three Horizons of Growth: A bubble chart plots key projects. ‘ConnectAI’ and the now-terminated ‘Swift’ are large bubbles in Horizon 1. ‘Project Apollo’ is a medium-sized bubble in Horizon 2. ‘Project Titan’, our quantum computing experiment, is a small, exploratory bubble in Horizon 3.
- Risk/Reward Matrix: A 2×2 matrix shows ‘ConnectAI’ firmly in the ‘Pearls’ quadrant (Low Risk, High Reward). ‘Project Apollo’ is in the ‘Oysters’ quadrant (High Risk, High Reward), requiring careful management. The terminated ‘Project Swift’ is marked in the ‘White Elephants’ quadrant (High Risk, Low Reward), confirming the decision to stop it was correct.
Part 4: Key Project Summaries
| Project Name: | Project Apollo | Strategic Goal: | Develop next-gen predictive analytics platform |
| Project Lead: | Jane Doe | Horizon: | H2 |
| Stage: | Development | Status: | Amber |
| Budget (YTD): | $450k / $600k |
Problem: Our enterprise customers cannot accurately predict inventory needs, leading to costly stockouts.
Solution: An AI-powered platform that forecasts demand based on real-time sales and market data.
Validated Learnings (Last 90 Days):
- Confirmed with 10 beta testers that a forecast accuracy of 95% or higher is the primary purchase driver.
Next Steps:
- Complete core algorithm development by Q4 2025.
- Begin integration testing with three beta tester data sets.
Turn opportunities into a managed innovation portfolio
Learn how to govern projects, prioritize investment and keep progress, resources and expected value visible.
Measuring What Matters: Project KPIs
To fill out your template, you need good data.
But you don’t need dozens of metrics. Focus on a few key performance indicators (KPIs) that give you a complete picture.
The Balanced Scorecard of KPIs
Here are some examples of KPIs to track, organized by category. Pick one or two from each that are most relevant to your business.
| Category | Example KPIs |
|---|---|
| Inputs | R&D Spend as % of Revenue, # of Employees in Innovation Programs |
| Process | Average Time from Idea to Launch, Stage-Gate Conversion Rate |
| Outputs | # of New Products Launched, # of Prototypes Completed |
| Outcomes | % of Revenue from New Products, Return on Innovation Investment |
From Metrics to Decisions
A common mistake is using the same metrics for every project, as this can kill promising but unproven ideas.
You need to measure projects based on their stage of development.
- Core (Horizon 1) Projects: Focus on execution. Use traditional financial metrics like ROI, margin improvement, and efficiency gains.
- Transformational (Horizon 3) Projects: Focus on learning and discovery. Use “innovation accounting” metrics such as learning velocity, cost per learning, and validated/invalidated assumptions, as ROI is irrelevant here.
A great report is useless without a process for acting on it.
To connect your data to real outcomes, put a simple governance system in place to make sure your report drives decisions, not just discussion.
- Decision-making body: Establish a cross-functional portfolio management board with authority to approve, stop, or change project direction.
- Clear process: Implement a stage-gate system for objective “go/kill/pivot” decisions at key milestones.
- Regular cadence: Conduct quarterly portfolio review meetings, with reports sent beforehand, focused on critical decisions.
A great innovation report is a tool for making decisions, not a document that gets filed away. It should be simple, visual, and forward-looking.
This template changes the conversation with your leadership, allowing you to move from defending what you spent to discussing how you are building the future of the business together.
Automate Your Reporting with Accept Mission
Creating a portfolio report manually is a heavy lift, pulling data from scattered spreadsheets and presentations.
An innovation management platform automates this work, turning a tedious task into a simple, repeatable process.
Here is how a tool like Accept Mission helps you build a better report in less time:
- Manage your full innovation funnel: Capture, score, and select the best ideas to ensure your portfolio is filled with high-potential projects from the start.
- Automate live dashboards: Instantly generate portfolio balance, pipeline health, and financial charts from a single source of truth, eliminating manual data entry.
- Visualize your portfolio balance: Use built-in tools to map your projects on customizable matrices, helping you analyze risk, reward, and strategic alignment at a glance.
- Streamline project governance: Run your stage-gate process directly in the platform, ensuring every “go/kill” decision is tracked and based on consistent, data-driven criteria.
Teams can focus on analyzing insights rather than building reports, turning portfolio management into a continuous, strategic activity.
Book a demo with Accept Mission for a personalized session to build a dynamic, data-driven portfolio report quickly.










 English
 Dutch
 Portuguese
 Spanish
 French
 German
 Arabic
