
Launching Your Innovation Portal: A Plan for Your First 90 Days16 min read

It’s tempting to treat launch day as the finish line. In this plan, it’s only day 1, and the work starts with a prep month 30 days earlier.
Your first 90 days settle 4 things:
- Who answers a submission, and how fast.
- Whether people who didn’t submit can see the first real decision.
- Who carries the portal inside each department once the launch communications go quiet.
- What leadership accepts as evidence.
Volume isn’t one of them, which is why this plan builds answer capacity 1st and audience 2nd. Reach is the easiest thing to buy in week 1.
That order has a cost: seeding and a narrow pilot buy you nothing visible for weeks. So your week-one number will look small.
What Go-Live Actually Buys You
Go-live buys attention, and not for long. After that, the portal gets judged on what it answered.
BCG’s 2025 innovation report found that innovation has stayed a top-3 priority for 64% to 83% of firms every year.
Executive confidence went the other way. From 2021 to 2024, the share of executives who saw their companies as innovation leaders fell 24 percentage points.
Closing that gap starts before launch day. Here’s the plan at a glance: 4 windows, and what has to go right in each.
| Window | The one thing to get right | What you’d see if it worked |
|---|---|---|
| Days -30 to 0 | A response time with named reviewers behind it: 5 working days to a human reply, 15 to a funnel decision | A seeded portal and a first decision already on someone’s calendar |
| Days 1-30 | Meeting the published response time on every submission | Replies inside the window, from a named person, without chasing |
| Days 31-60 | One decision published where non-submitters can see it | Views or questions from people who never submitted, with first-time submissions tracked against month one |
| Days 61-90 | A standing review slot that outlives the launch team | A calendar invite, an owner, and a written month-four plan |
The gap between stated priority and the ability to deliver tends to show up in the budget. An ERP rollout is a fair analogy here, and an uncomfortable one.
Gartner research cited by Prosci projects that by 2027, more than 70% of recently implemented ERP initiatives will fail to fully meet their original business case goals.
Organizations spend an average of 92% of their ERP implementation budget on technical activities and 8% on change management, Prosci’s own benchmarking adds.
Expect portal budgets to lean the same way. Configuration and communications get funded, and the capacity to answer a submission gets assumed.
That’s ERP research about ERP budgets, so treat it as an analogy. Before launch, check whether your budget funds anyone to answer.
Days -30 to 0: Build the Answer Before You Build the Audience
Intake design has to be settled before this window opens. Fields, categories, and intake mode belong to a different conversation.
This month is about capacity. Nothing on the list below is a page or a field. None of this needs guessing.
6 gates settle it before day 1:
| Gate | What has to be true | How you know it’s true |
|---|---|---|
| Named reviewers | Each reviewer has accepted the role in writing, category by category | Every category on the portal maps to a person, and none routes to a shared inbox |
| Published response time | Reviewers have agreed to 5 working days to a human reply and 15 to a funnel decision | It appears on the portal page and in the launch email |
| Seeded submissions | At least 10 real ideas, credited to real people | Each one has a name attached and a reply already drafted |
| Champion coverage | Every in-scope department has a named champion | The launch list and the champion list match name for name, with no department left blank |
| A first decision scheduled | A review date sits in the calendar before day 1 | The sponsor has accepted the invite |
| Agreed evidence | The sponsor has accepted response time and published decisions as the month-one measures | It’s written in the launch memo, not just understood |
A gate that isn’t closed moves day 1. Slip the launch by 2 weeks if that’s what it takes to avoid a portal nobody answers.
Also, gates get waived quietly. A date in a steering deck outranks a reviewer who agreed to nothing.
The question here is blunt. If 20 submissions arrive in the first 2 weeks, who reads them and by when?
Answer that with names and calendar slots. Every row above names a person who has to do something after launch.
Seed the Portal So It Isn’t Empty on Day 1
An empty portal on day 1 is a real cost. The 1st visitor learns that nobody’s bothered yet.
FeverBee’s 2012 empty-launch warning is unsentimental: “This organization has sent their entire audience to visit an empty community. What a waste.”
Seeding the portal takes 3 steps:
- Talk to a handful of target participants before the platform is ready.
- Fill the portal with the ideas those conversations produced, credited to their authors.
- Rehearse the response by replying to those items before day 1.
Step 1 is FeverBee’s recommendation, written for external online communities. The sequencing principle still transfers.
10 seeded submissions with real names attached is a workable target. Anonymous filler reads as filler, and people can tell.
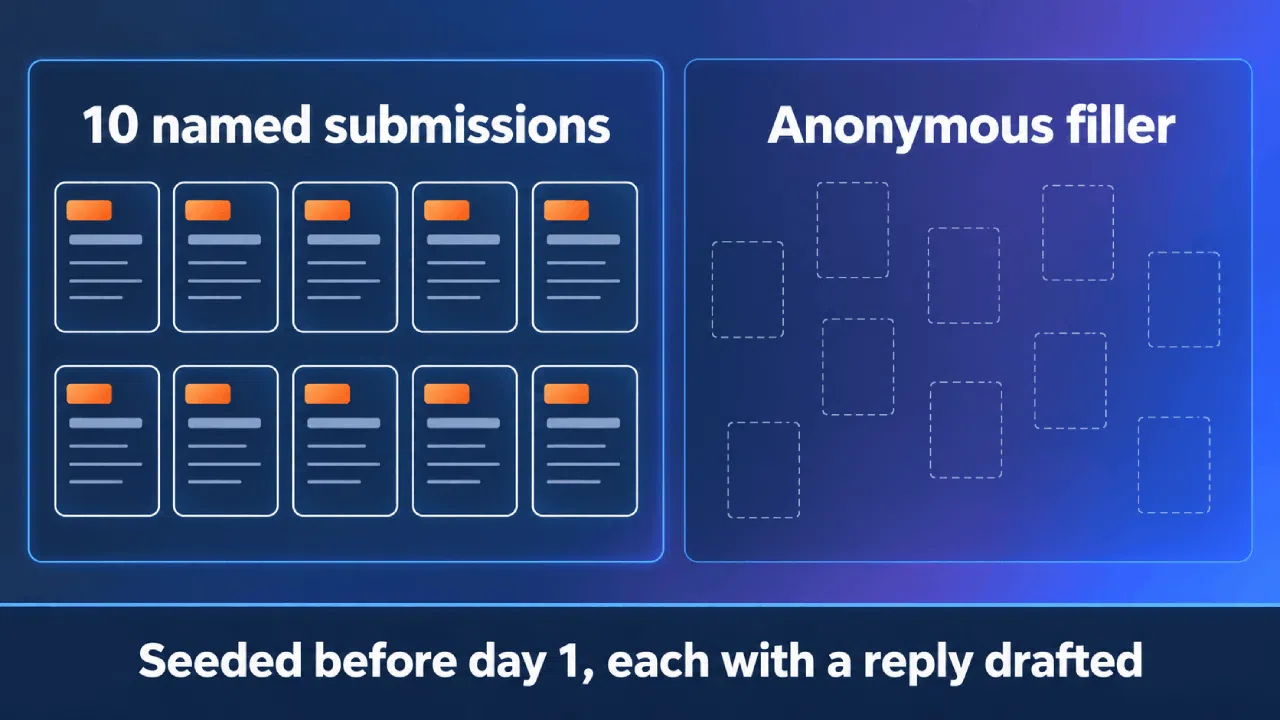
Don’t skip step 3. Rehearsal lets reviewers learn the decision note format on seeded items, before a real submitter is waiting.
Recruit Champions Before You Recruit Submitters
A champion is a named person in a department who’ll answer “what is this for?” without escalating. You want 1 per unit.
The ask is small and specific:
- Answer questions locally.
- Flag submissions worth a reviewer’s attention.
- Say when the portal has gone quiet.
In return they get early sight of decisions and their name on the launch memo. Both are currency in a large organization.
Organizations that deployed a change agent network met or exceeded project objectives 50% of the time, against 41% for those that didn’t, Prosci’s benchmarking found.
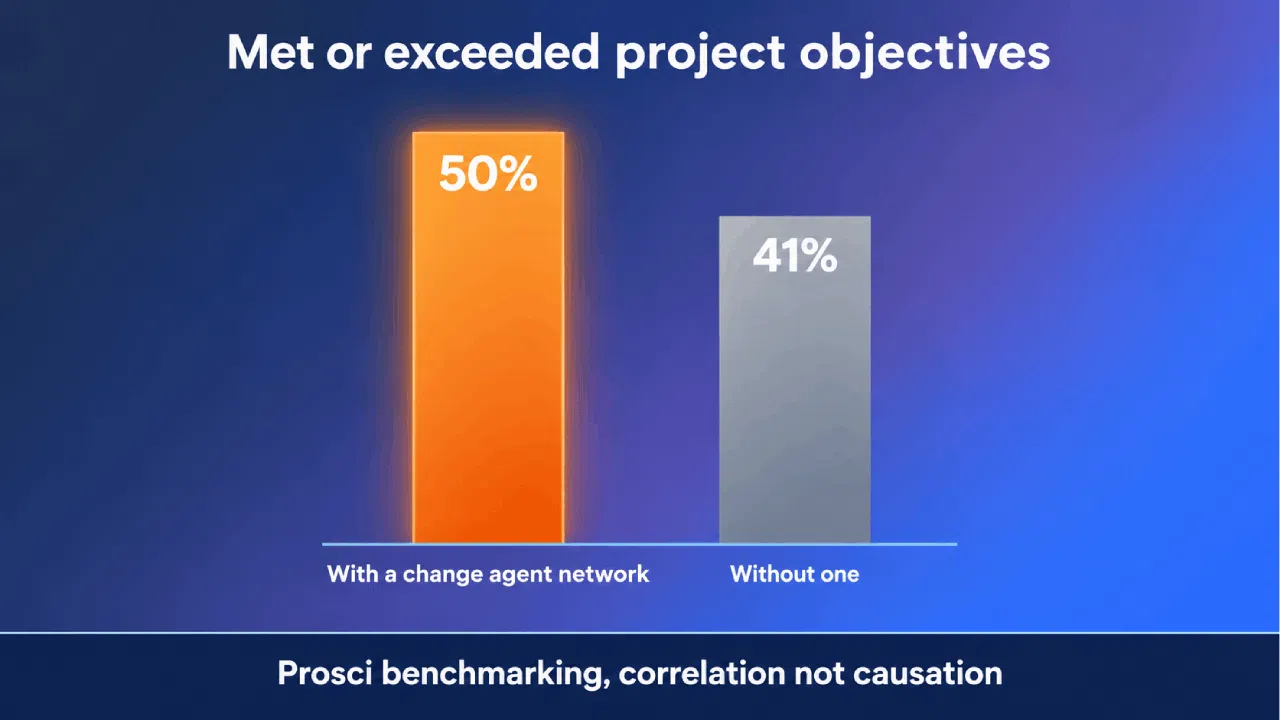
It’s a correlation, and it doesn’t prove the network caused the difference.
Recruit them in person, 1 conversation at a time. A group email collects replies – what you need is a commitment.
The named conversation is the point. Somebody who said yes to a person behaves differently from somebody who clicked a form.
Days 1-30: What the First Replies Teach
Month 1 is where the portal teaches people how it behaves. Whatever happens to the first 20 submissions becomes the story.
The person who submitted is the one who tells it. Colleagues believe them because they were there.
Publish a Response Time and Then Meet It
Pick a number and publish it.
5 working days to a human reply, 15 to a funnel decision. Publishing commits you in public, which is exactly why the step gets skipped.
The number needs a miss protocol behind it:
- Day 3 pings the reviewer, and day 4 pings the champion.
- No reply by day 5 hands the item to a named backup, who also covers leave.
- No decision by day 15 puts it on the next review agenda, with an apology and a new date for the submitter.
A reply doesn’t have to be a decision: “Received, in review, decision by the 14th” ends the uncertainty. Silence with no stated end is the alternative.
Maister’s 1985 principles for service queues name 2 that carry over: “Uncertain Waits Are Longer than Known, Finite Waits” and “Unexplained Waits Are Longer than Explained Waits.”
An unanswered submission teaches something worse. Organizational research has a name for the resulting climate.
Morrison and Milliken described a “climate of silence” in 2000. Its first shared belief is that “speaking up about problems in the organization is not worth the effort.”
An ignored submission is a small, precise lesson in that first belief.
Open Narrow, Not Wide
A broadcast to 5,000 people buys a submission spike. A spike you can’t service is worse than no launch at all.
The first non-answer is the moment the organization learns how the portal actually works, and it learns quickly.
So roll out in this order:
- Pick 2 or 3 departments to open with.
- Give them the champions, the reviewers, and the published response time.
- Widen in month 2, once the reviewers have proved they can keep pace.
In the 2003 edition of Rogers’ diffusion of innovations model, innovators are the first 2.5% to adopt, and early adopters the next 13.5%.
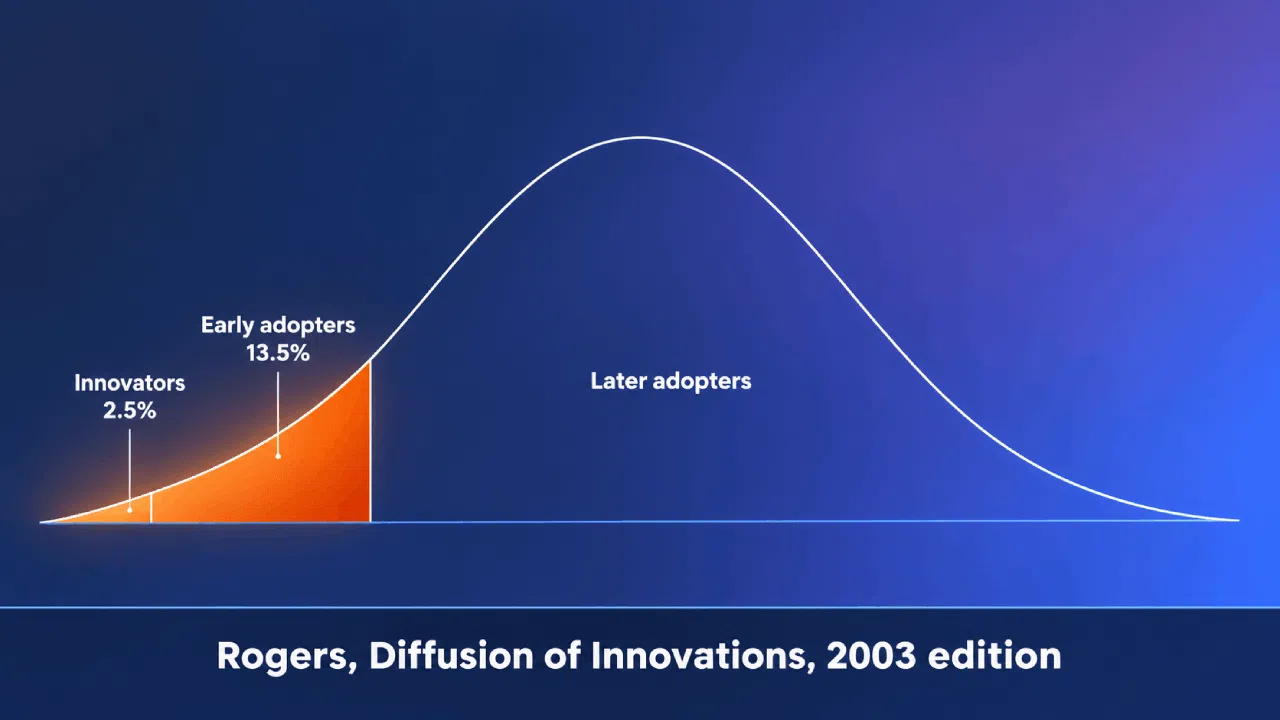
Those percentages describe a distribution, and they’re not a pilot-sizing formula. The useful part is directional: your first cohort is small, identifiable, and already interested.
The modest week-1 number buys something. A serviced pilot produces reference stories; a broadcast produces a backlog.
Adding departments is cheap. Recovering credibility costs a great deal more.
Days 31-60: Make the First Decision Visible
By day 31 you have submissions and, if the reviewers held, replies. What you probably don’t have yet is a decision anyone can see.
Month 2 tests whether a visible decision brings new people in. You either produce one or explain why you couldn’t.
This is also the month you widen past the pilot departments. Add departments only as fast as reviewers keep pace, and give each a named champion first.
Show the Decision, Including the No
The published no is worth more than the published yes, because it proves the funnel has a mechanism behind it.
Take one submission all the way through:
- Fund it, kill it, or park it.
- Write up the reasoning, and name the person who made the call.
- Publish the decision and the reasoning where people who never submitted anything will see them, in the channel they already read.
An anonymous decision reads as policy, and policy doesn’t invite a second submission. A decision seen only by the submitter changes one person’s behavior.
A no with reasoning is also a template. Anyone reading it learns what a strong submission looks like here.
In Deloitte’s 2021 study, organizations with leading innovation maturity were more likely to consider failures as positive and celebrate lessons learned (78% vs. 54%).
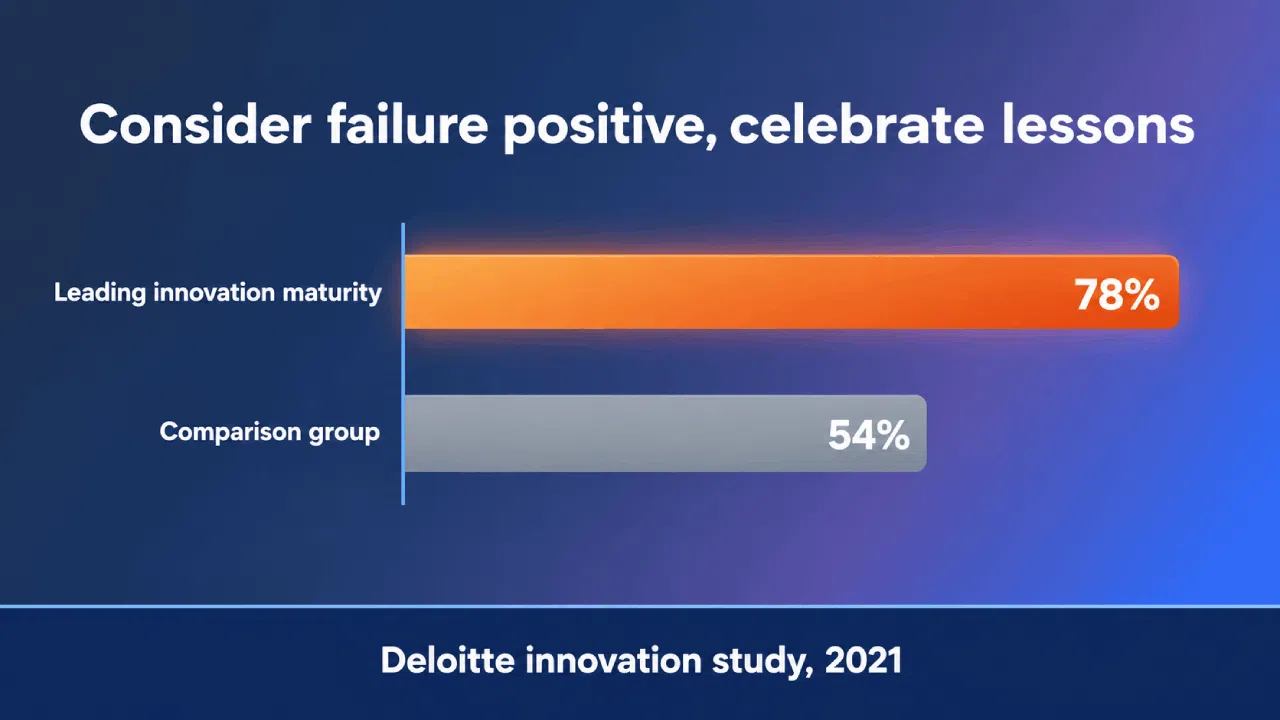
Those figures describe innovation maturity, so don’t read them as a portal metric. They do describe the posture a visible no requires.
Plan for a Novelty Dip
Plan for submissions to dip once the novelty wears off. One classroom study gives that kind of dip a rough shape.
The 2022 longitudinal study of gamification tracked the coursework activity of 756 Brazilian introductory programming students over 14 weeks. The curve had 2 halves:
- The effect “started to decrease after four weeks, decrease that lasted between two to six weeks.”
- Impact then “shifted to an uptrend between six and 10 weeks after the start of the intervention, partially recovering its contribution naturally.”
A classroom isn’t a workplace, so treat the curve as an analogy. The part that carries over: plan for the dip, and don’t count on a full rebound.
Warn your sponsor in week 3 that a dip is possible, so any dip arrives as a forecast. A forecast that lands protects the whole program while a surprise in week 5 costs you the benefit of the doubt.
Have something scheduled for week 5. A themed campaign or a department challenge gives people a fresh reason to submit.
Days 61-90: Hand the Portal to a Cadence
Launch energy has a half-life, and yours is spent by day 61. What replaces it is a calendar.
The last 30 days are about converting attention into a standing commitment that survives your next reorganization.
Move Sponsorship From Launch Moment to Standing Slot
Your sponsor did the launch video. Now they need a recurring slot where funnel decisions actually get made.
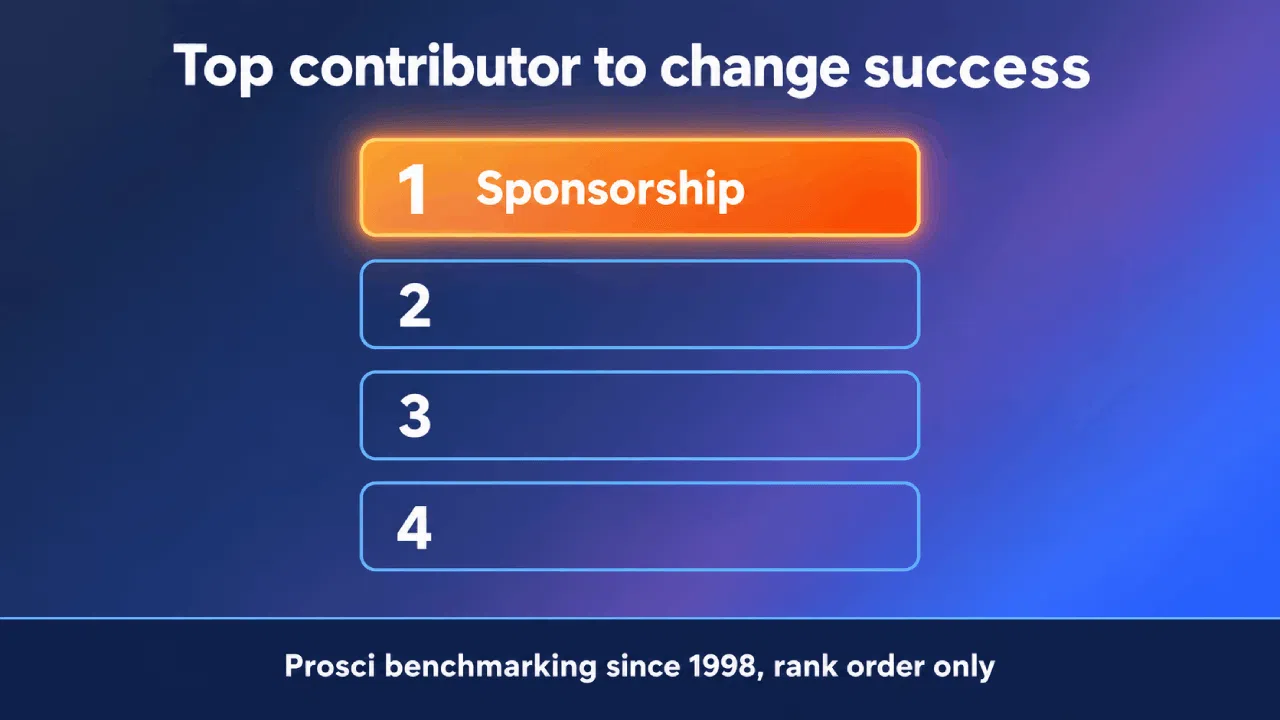
Prosci’s benchmarking reports have ranked sponsorship the top contributor to change success in every edition since 1998. That’s a rank order, and it says nothing about effect size.
PMI’s 2014 research on sponsor engagement puts numbers on sponsorship from a general project-management angle.
Where sponsors frequently took all 5 of the most important actions, 75% of projects met goals and intent, versus 57% where they took none of them frequently.
PMI’s failure attribution runs alongside it. 1 in 3 unsuccessful projects fails to meet goals due to poorly engaged executive sponsors.
Book the slot in the calendar before day 90. A recurring meeting outlives enthusiasm, and enthusiasm is what you’re losing.
Write Down What Happens in Month 4
The 90-day plan ends. The portal doesn’t.
The month-four plan decides whether the portal keeps its shape. Write it before day 90, while the launch team still exists.
The plan lives on a portal page anyone can open. It needs 4 things:
- An owner, named, who isn’t you by default.
- A decision cadence, with the next 3 review dates already in the calendar.
- A published response time, and a person accountable for meeting it.
- The champion network, handed to someone who’ll keep it active.
After day 90, the month-4 plan stops being a commitment and becomes somebody’s side project.
Toyota’s creative idea suggestion system is the long-run case, as told in a 1973 company announcement. Its first year, 1951, produced 789 suggestions.
The adoption rate rose from 29% in 1956 to 76% in 1972, which is the interesting movement in that history.
For 1973, with 43,000 employees, the company expected the number of suggestions to surpass 250,000, with more than 70% of them being adopted.
The announcement credits a carefully devised submittal procedure for the adoption gains. Scale came with answer capacity: an 800-member Screening Board was evaluating thousands of suggestions each week.
The Numbers Worth Watching in the First 90 Days
Early metrics have one job. They tell you whether the response machine is working, before volume can tell you anything.
In 2018, only 26% of senior managers strongly agreed that their key performance indicators were aligned with their organization’s strategic objectives, MIT Sloan research found.
| What to watch | What it tells you | When you can start reading it | How it gets gamed |
|---|---|---|---|
| Time to first human reply | Whether the answer capacity is real | Day 1 onward, against the published 5 working days | Template replies that close the thread and say nothing |
| Time to funnel decision | Whether the 15-day promise holds | Week 3 onward, against the published 15 working days | Parking items by default so the clock stops |
| Share of submissions with a named reviewer | Whether ownership is distributed or bottlenecked | Week 2 onward | Reviewers assigned on paper who never open the item |
| Decisions published per month | Whether the funnel moves | Day 31 onward | Trivial calls published to keep the count up |
| Repeat submitters | Whether the loop closed for someone | Day 45 onward | Champions submitting again to fill the gap |
| Submissions from non-pilot departments | Whether the portal is spreading past the first cohort | Day 60 onward | Reporting a department as covered because one person registered |
Notice what’s absent from that table. Total submissions appears nowhere, and that’s deliberate.
Arthur D. Little argued in 1999 that companies typically use only “hard” lagging data, such as “revenues from new products.”
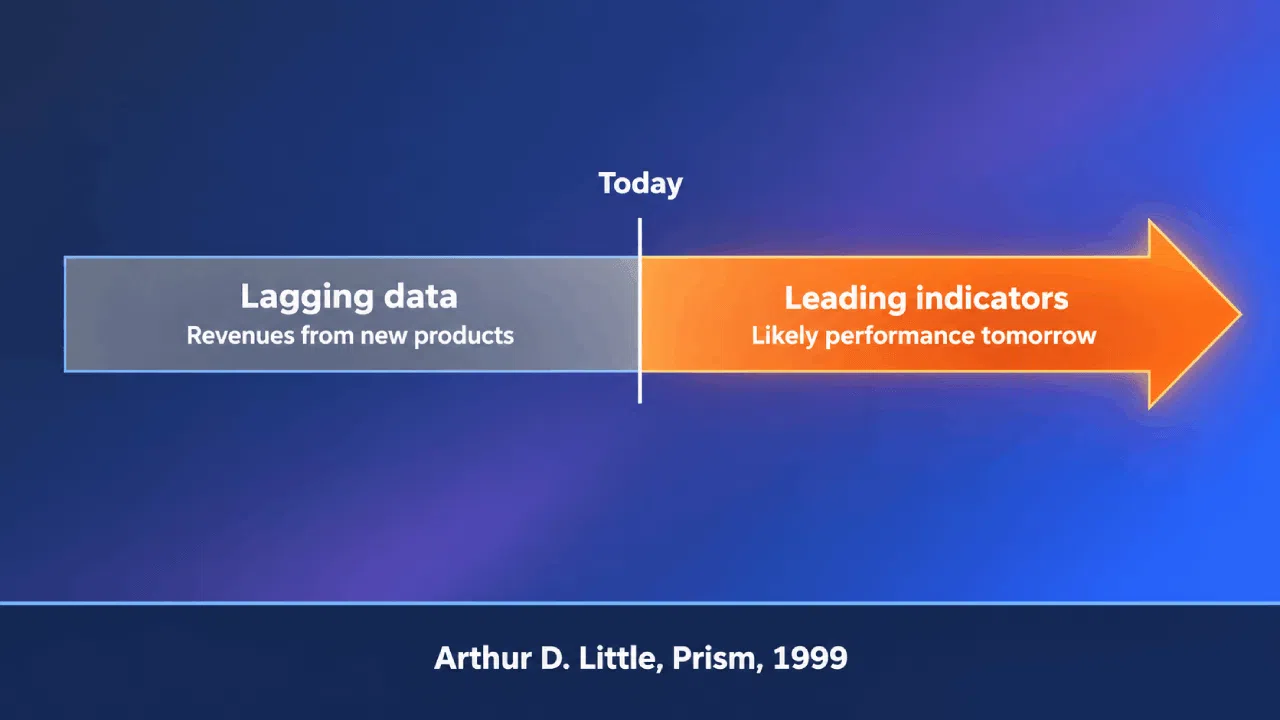
Those metrics provide “only a narrow ‘rear-view mirror’ perspective on innovation,” while leading indicators answer the better question, “How well are we likely to do tomorrow?”
Revenue from new products rarely shows up within 90 days. Lead the sponsor report with response time and decision throughput, because those are the promises the launch made.
Deloitte’s 2021 study also found that organizations rating their innovation capability as leading were likelier to set targets and measure idea conversion (50% vs. 39% of average respondents).
The Numbers That Look Good and Teach You Nothing
Some numbers move for reasons you can’t act on. Page views on the portal are the clearest example here.
Eric Ries called these vanity metrics in 2009: “They might make you feel good, but they don’t offer clear guidance for what to do.”
3 more numbers deserve the same suspicion:
- Registered users: a number that rises when IT provisions accounts tells you about IT.
- A published submission-count target: it gets met, and the volume arrives as duplicates, near-empty entries, and ideas nobody intends to develop.
- Response-time compliance: a reviewer can close threads with a template that answers nothing.
Goodhart’s law, in the wording Marilyn Strathern gave it in 1997, holds that “when a measure becomes a target, it ceases to be a good measure.”
So audit a sample by hand each month. Read 10 replies and ask whether you’d accept them. The audit takes an hour, and a dashboard won’t surface a hollow reply. But reading them will.
Honestly, there’s nothing glamorous about this one. It’s also what keeps the other numbers honest.
Announce the Answer, Then Announce the Portal
The announcement is the last thing you build before day 1. The email leads with names and the response time – the portal link goes last.
That email has to stand behind 3 claims:
- A named reviewer for every category, with a published response time they’ve agreed to in writing.
- 10 seeded submissions and a first decision already scheduled.
- Champions who’ll answer questions in their own department without escalating.
Get those right and you’re sending an invitation. Get them wrong and you’re sending a promise you’ll break in week 2.
Download the free guide Idea Collecting: From Organizational Signals to Ideas and learn how to design activation with governance and close the loop with contributors.
Or request a demo to see how Accept Mission’s dashboards show where each submission sits, so your reviewers can keep up with everyone you invite.











 English
 Dutch
 Portuguese
 Spanish
 French
 German
 Arabic
