
Dashboards and reporting
Real time visibility into innovation performance and portfolio health
Make better decisions with clear and structured insight. Dashboards and reporting provide leadership and teams with real time visibility into idea pipelines, scoring results, participation levels, and portfolio progress. Track performance, identify bottlenecks, and measure impact with data that supports transparent and accountable innovation management.
Guided tour and save time







Why dashboards and reporting matter
Innovation creates value only when performance is visible. Dashboards and reporting transform fragmented data into structured insight, giving leaders clarity on progress, risk, and measurable impact.
Without structured dashboards and reporting
- Leaders rely on manual updates and inconsistent data
- Progress is difficult to compare across teams and portfolios
- Risks and bottlenecks remain hidden too long
- Impact is hard to demonstrate to stakeholders
With dashboards and reporting
- Real-time visibility across initiatives and portfolios
- Consistent metrics aligned with strategy and governance
- Early detection of delays, gaps, and resource constraints
- Clear evidence of value creation and ROI
What you get
Dashboards and reporting provide structured visibility across your innovation portfolio, turning raw activity into measurable performance insight.
- Real-time dashboards across funnels, projects, and portfolios
- Configurable KPI tracking aligned with strategic goals
- Clear overview of progress, stage distribution, and pipeline health
- Portfolio performance insights across impact, risk, and investment
- Automated reporting for leadership and governance reviews
- Exportable reports for board-level and stakeholder communication
- Trend analysis to monitor performance over time

Who it’s for
Primarily designed for innovation teams responsible for structure, decisions, and measurable progress. Secondarily for organizational stakeholders who guide strategy, allocate resources, and evaluate results.
Innovation Managers
Own the innovation process and require full visibility across funnels, governance, decisions, and portfolio impact.
Innovation Leaders
Align innovation with strategy and need clear portfolio steering based on value, risk, and evidence.
Innovation Specialists
Execute initiatives and need structured workflows for intake, validation, evaluation, and next-step clarity.
Strategy & Transformation Teams
Ensure innovation supports strategic priorities and require transparency into progress and expected outcomes.
Portfolio, PMO & Governance
Oversee decision frameworks and resource allocation, requiring structured criteria and stage visibility.
Business & Product Leaders
Make implementation decisions and need clarity on ownership, business cases, risks, and expected impact.
AI enhances dashboards and reporting
AI turns dashboards from static reporting tools into intelligent performance systems. Instead of manually interpreting metrics, teams receive insights, alerts, and forward looking signals that support better decisions.
AI Capabilities
- Automated KPI anomaly detection
- Predictive trend forecasting across portfolios
- Risk signals based on progress patterns
- Suggested focus areas for underperforming initiatives
- Dynamic summaries for leadership reporting
- Correlation analysis between impact, investment, and outcomes
- Smart narrative generation for executive updates
- Scenario modeling for investment and capacity planning
Impact
- Earlier identification of performance risks
- Improved forecast accuracy across innovation portfolios
- Faster preparation of board ready reporting
- Stronger alignment between strategy and measurable results
- Reduced manual analysis and spreadsheet work
- Clearer executive decision support based on real data
Key features for dashboards and reporting
Funnel intelligence
Measure how ideas convert from intake to validated initiatives across every stage
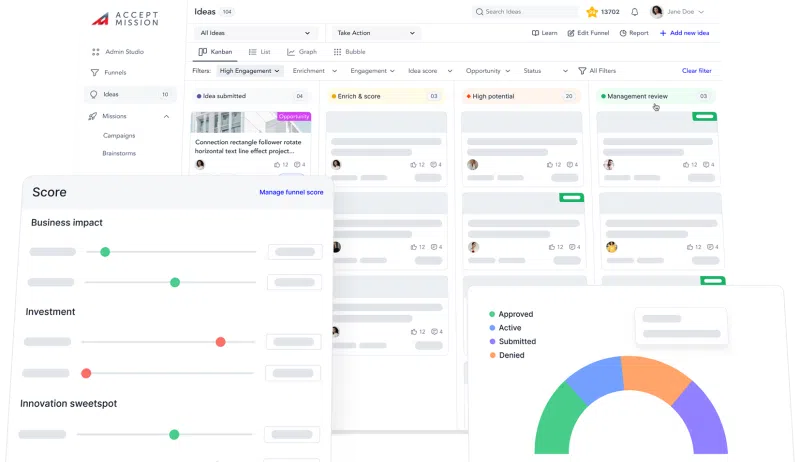
Funnel Intelligence provides structured visibility into how initiatives move through your innovation system. It reveals progression patterns, stage performance, and conversion quality so leaders can improve flow and stop weak initiatives earlier.
- Stage-to-stage conversion tracking across funnels
- Drop-off analysis between evaluation gates
- Time-in-stage monitoring for cycle time control
- Bottleneck identification across review phases
Portfolio insights
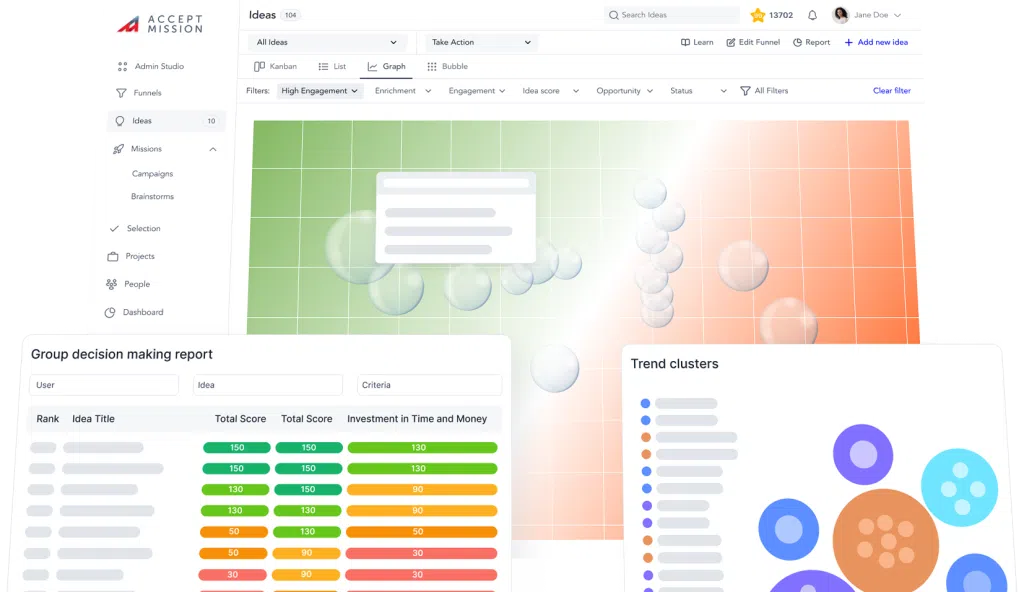
Identify emerging trends, recurring themes, and strategic focus areas across your portfolio
Portfolio Insights transforms structured innovation data into clear signals. It helps organizations understand where attention is concentrated, which themes gain momentum, and how innovation activity aligns with strategic priorities.
- Topic clustering across submitted ideas
- Trend evolution analysis over defined periods
- Heatmaps of strategic themes and categories
- Volume distribution by department or region
Mission governance
Monitor how missions and strategic initiatives perform against defined objectives.
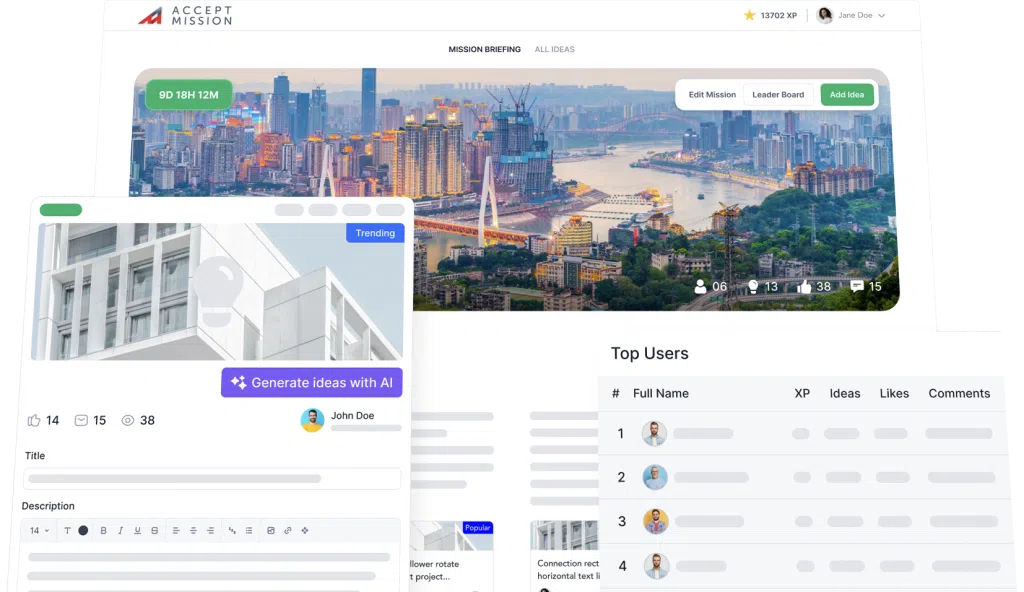
Mission Governance creates transparency across execution and accountability. Leaders gain a clear overview of progress, engagement, and alignment with strategic goals.
- Progress tracking against mission goals
- Completion rates across strategic initiatives
- Participation and engagement visibility
- Alignment tracking between initiatives and strategy
Value realization
Connect innovation investments to measurable financial outcomes and portfolio impact
Value Realization links innovation activity to economic performance. It ensures investment decisions are transparent and impact is measurable across the portfolio.
- Investment tracking across initiatives
- Forecasted versus realized ROI comparison
- Cost-to-impact visibility
- Financial performance by portfolio segment
Product Tour: Project and Innovation Portfolio Management
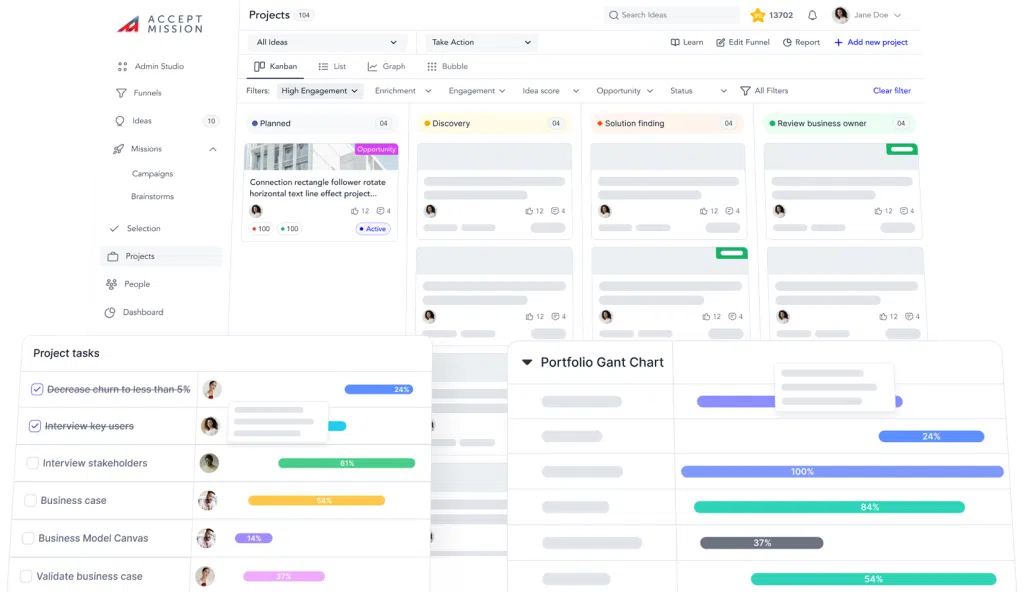
Explore how organizations structure project funnels, manage execution, balance workloads, and maintain full portfolio visibility with governed innovation and project management.
Project Funnels
Structure initiatives into clear portfolio funnels with defined stages, approval gates, and real-time visibility into progress and performance.
Task and Workload Tracking
Monitor tasks, ownership, and team capacity to ensure balanced workloads and predictable delivery across projects.
Canvases and Templates
Apply structured canvases and standardized templates to guide project definition, validation, and consistent documentation.
Explore the full Project and Innovation Portfolio Management tour
See how portfolio funnels, execution tracking, and structured templates connect in one governed system for managing projects and innovation at scale.
Ready to see it live?
A short walkthrough that shows how structure, transparency, and dashboards make progress visible and decisions easier.

See Accept Mission in action
Run your innovations with structure and transparency. In a short demo, see how idea management, project portfolio management, and idea collecting connect to funnels, scorecards, and dashboards so progress stays visible and decisions get easier.
- Structured funnels
- Transparent scoring
- Dashboards for progress
What you will see
- Idea collecting that feeds a structured funnel
- Transparent evaluation with scorecards and clear decisions
- Portfolio views and dashboards for leadership reporting


 English
 Dutch
 Portuguese
 Spanish
 French
 German
 Arabic
