
Why Portfolio Reviews Break Down (And the 6 Canvases That Fix It)11 min read

Walk into most portfolio reviews and you’ll find the same problem: the criteria shift depending on who’s in the room. One project gets five minutes, another gets twenty.
By the end you’re not sure which projects moved forward because they were strong and which moved forward because someone knew how to present.
Portfolio review consistency comes from structure.
A portfolio canvas is a constrained, one-page framework that forces every project team to surface the same data before anyone walks in: hypothesis, validation evidence, confidence level, and risk profile.
Six canvas types cover the full review cycle. Each is designed for a specific moment, and matching the right canvas to the right moment is where decision quality actually improves.
Why Portfolio Reviews Break Down Without Structure
Without a standard framework, portfolio reviews run on persuasion rather than evidence. Resources flow to the most compelling presenter, not the most validated idea.
Four patterns emerge when reviews lack structure:
- Pet project syndrome. Resources flow to advocates, not evidence. A senior leader’s idea outlives a better-validated one from a junior team member.
- Risk imbalance. Boards default to incremental because it’s easy to defend. About a third of transformational projects get underfunded for lack of a framework to evaluate non-linear bets.
- Sunk cost trap. No consistent stage-gate means projects drift. By the time they surface for review, the committee is defending prior spend, not assessing future viability.
- Strategic conflation. A routine IT upgrade enters the innovation portfolio because nobody defined what “innovation” means. The portfolio bloats.
84% of executives say innovation is crucial to their growth strategy. Only 6% are satisfied with their innovation performance.
The gap between aspiration and outcome is a governance gap. Without structured portfolio oversight, good bets stall while misaligned projects consume budget.
A standard canvas won’t eliminate these patterns overnight. But it makes them visible, and that’s where you start.
Canvas vs. Template: What’s the Actual Difference
A generic project template organizes execution: tasks, budget spend, timeline progress. These are useful once a decision to move forward has already been made.
A canvas operates at a different moment.
It captures the information needed to make the decision in the first place:
- Hypothesis
- Validation evidence
- Confidence level
- Risk profile
A full status deck can sprawl across thirty slides and still avoid the question of whether the project should continue.
A canvas fits on one page because it forces distillation. And distillation reveals what actually matters.
| Aspect | Generic Template | Canvas |
|---|---|---|
| Primary Focus | Operational tasks and budget tracking | Strategic hypothesis and validation evidence |
| Data Structure | Detailed line items (tasks, milestones, costs) | Compressed strategic dimensions (risk, alignment, confidence) |
| Key Indicators | Timeline adherence, spend variance, task completion | Confidence score, risk profile, evidence quality |
| Review Utility | Status updates; direction already set | Decision support; designed for go/no-go gates |
| Ecosystem View | Project-level snapshot | Portfolio-level intelligence |
Both tools have a role. The canvas comes first.
The 6 Canvases: And When to Use Each
Each canvas is designed for a specific phase in the innovation lifecycle, from initial intake through to pre-integration review.
Used in the right sequence, they replace the subjective slide deck with a consistent evidence record. The decision isn’t which canvas to use. It’s matching each canvas to the right gate.
1. Strategic Alignment Canvas
When to use: Initial intake, and quarterly strategic reviews.
This canvas maps each project to a specific corporate objective. Not a vague value. A specific lever:
- Expand market share in Asia-Pacific
- Reduce manufacturing cost per unit by 15%
- Accelerate time-to-market for new categories
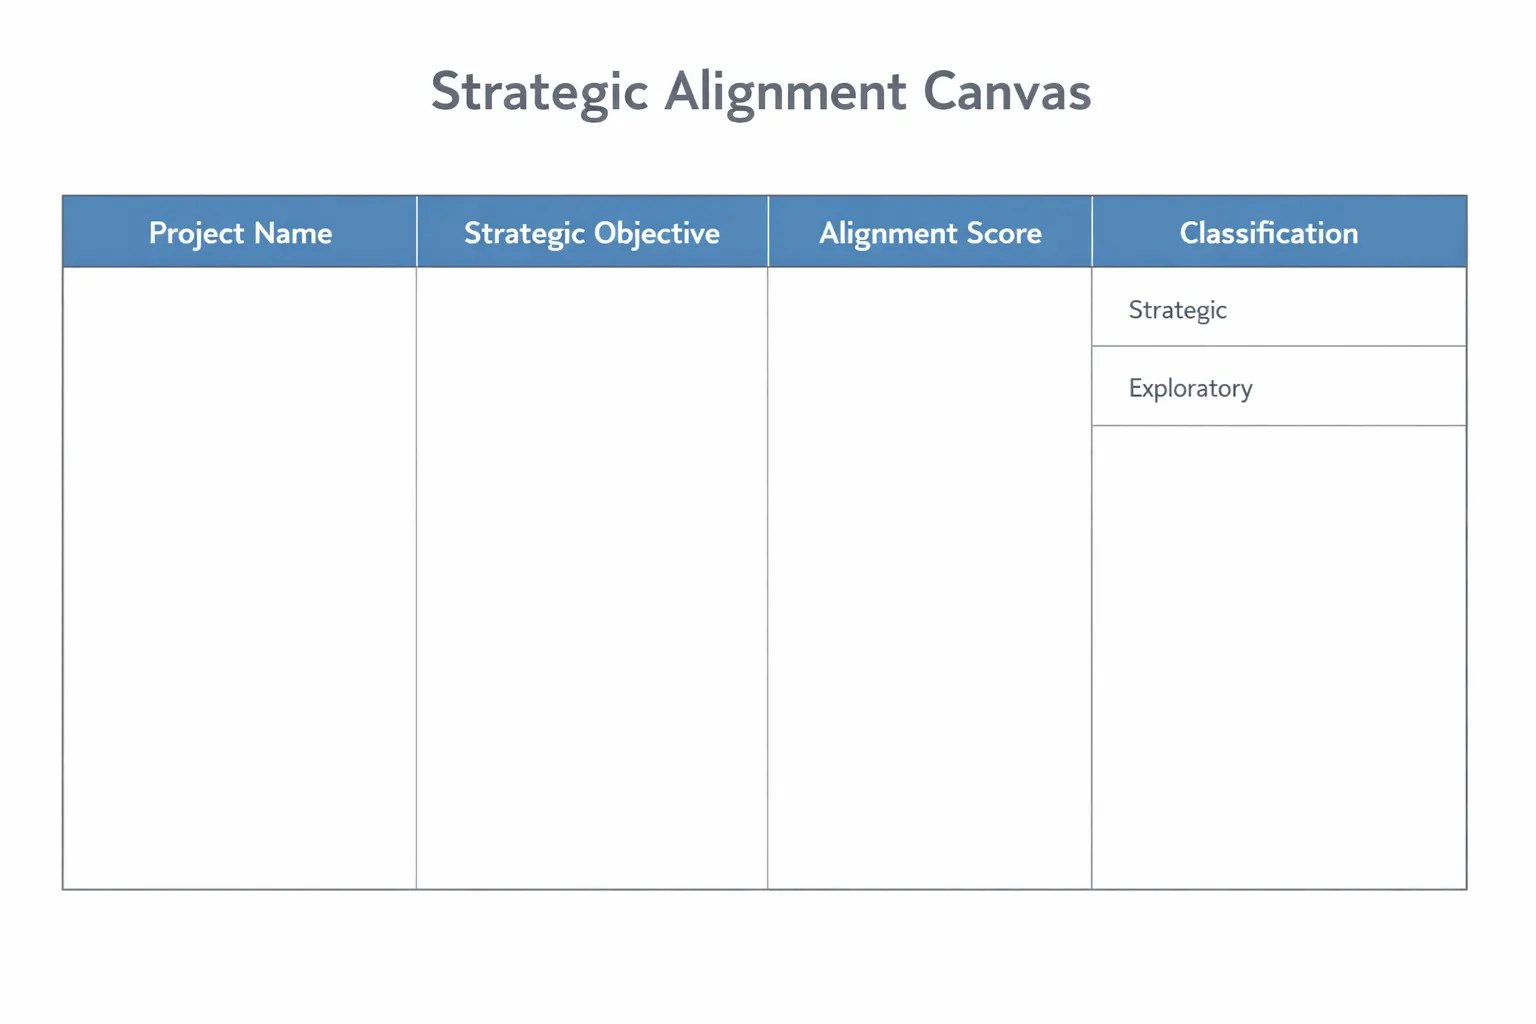
If a project doesn’t map cleanly to one of these, the review committee has a clear signal.
The project may still be worth pursuing, but it needs to be classified and funded as exploratory, not as a strategic initiative.
When every project must name its strategic lever in a constrained field, it becomes obvious which initiatives belong in the innovation portfolio and which belong in IT operations or business-as-usual planning.
The filter runs before any serious resource commitment. It’s lightweight enough to run monthly if your organization is frequently adding new projects.
2. Innovation Ambition Matrix Canvas
When to use: Annual planning, and macro portfolio rebalancing.
This canvas plots all active projects across four zones:
- Incremental – core business, lower risk
- Breakthrough – adjacent markets, moderate risk
- Transformational – new business lines, high risk
- Radical – platform-level shifts, highest risk
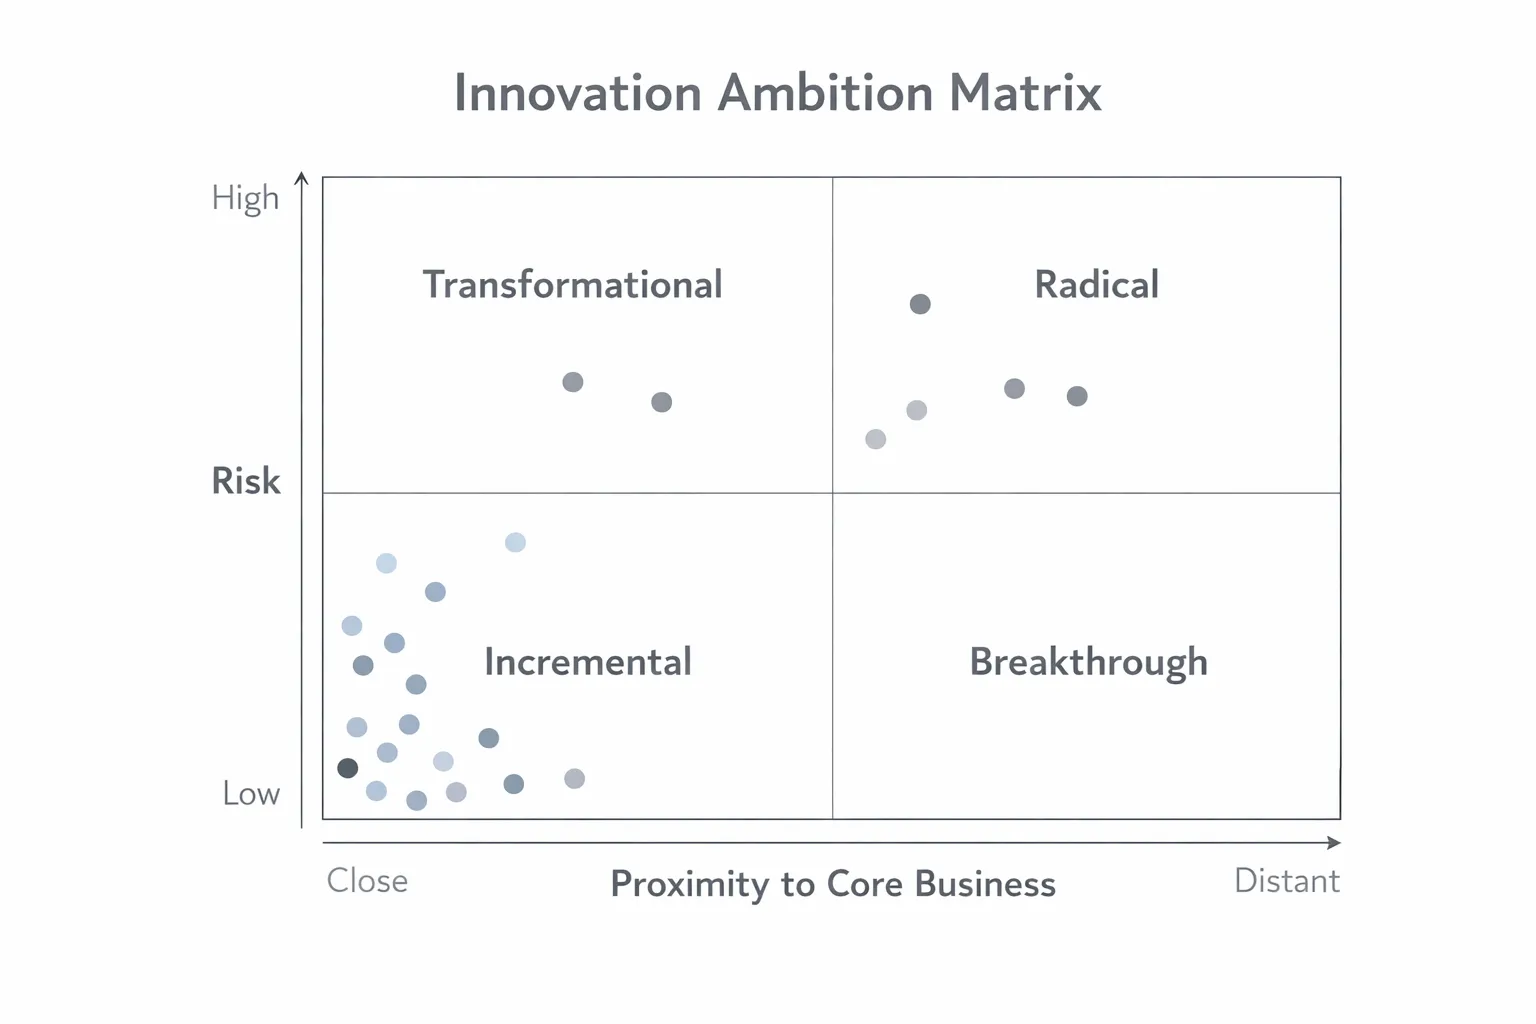
The matrix exposes concentration risk. Many organizations discover they’ve placed 90% of innovation resources in the incremental zone.
That’s often a rational response to quarterly targets. But over time, it starves the pipeline of future growth options.
Successful innovation portfolio management requires accepting that most projects won’t scale. The purpose of the Ambition Matrix isn’t to predict winners.
It’s to force a deliberate resource allocation conversation with the board: what percentage goes to incremental, what goes to breakthrough, what goes to transformational.
And to review that split annually rather than letting it drift.
3. Project Status Canvas
When to use: Monthly or bi-weekly gate reviews.
This canvas replaces the bloated status deck. It captures five fields:
- Problem hypothesis: what customer need or market opportunity does this address?
- Money In: capital deployed to date
- Capacity In: team hours and resources committed
- Impact Out: projected benefit if successful (revenue, cost savings, market share)
- Confidence Score: probability of success, weighted by empirical evidence, not modeled ROI
The confidence score is the most important field. It’s tied to validated evidence: customer interviews completed, prototype feedback, pilot launch results, proof-of-concept data.
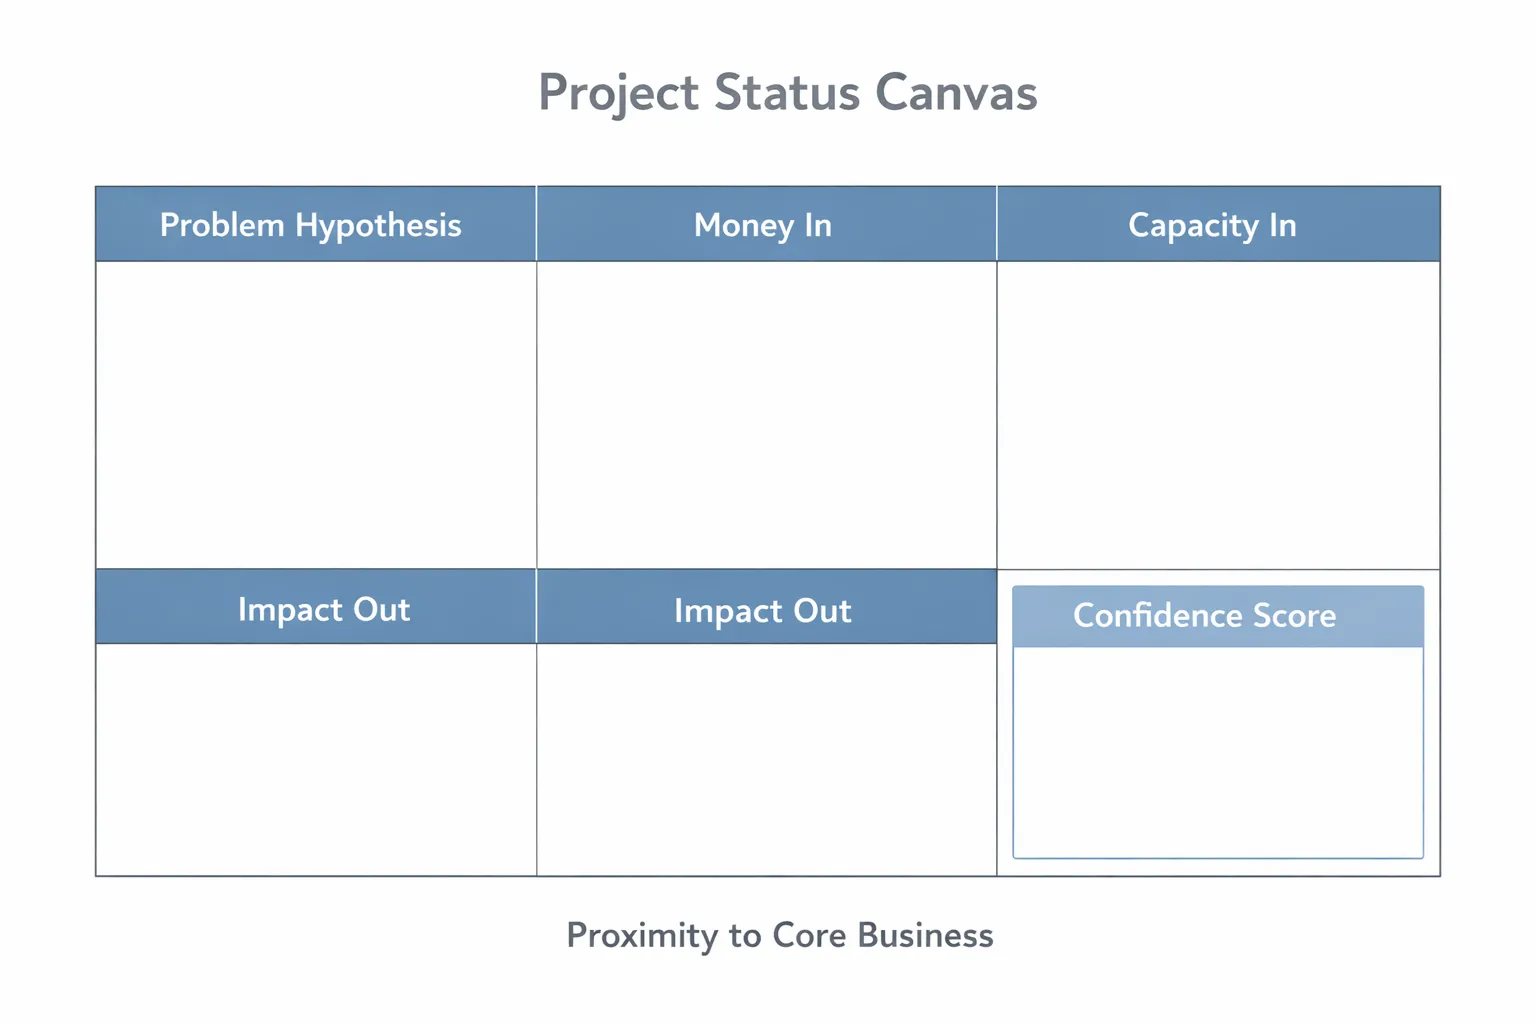
The score rises as evidence accumulates. That’s a repeatable logic the whole committee can apply consistently.
It also anchors the gate decision: under 30%, kill or pivot; between 30-60%, run the next validation experiment; above 60%, move toward execution.
Gate reviews work better when they support projects, not just judge them.
The canvas fields give reviewers precise questions to ask: what evidence would move your confidence score? What experiment would de-risk the biggest unknown?
That’s a different conversation than a thumbs up or thumbs down on a seventy-slide deck.
4. SWOT & Risk Mitigation Canvas
When to use: Before moving from validation to execution or scaling.
A traditional SWOT analysis is a brainstorm. Strengths go in one quadrant, weaknesses in another, and the output is a list that nobody owns.
This canvas is structured differently.
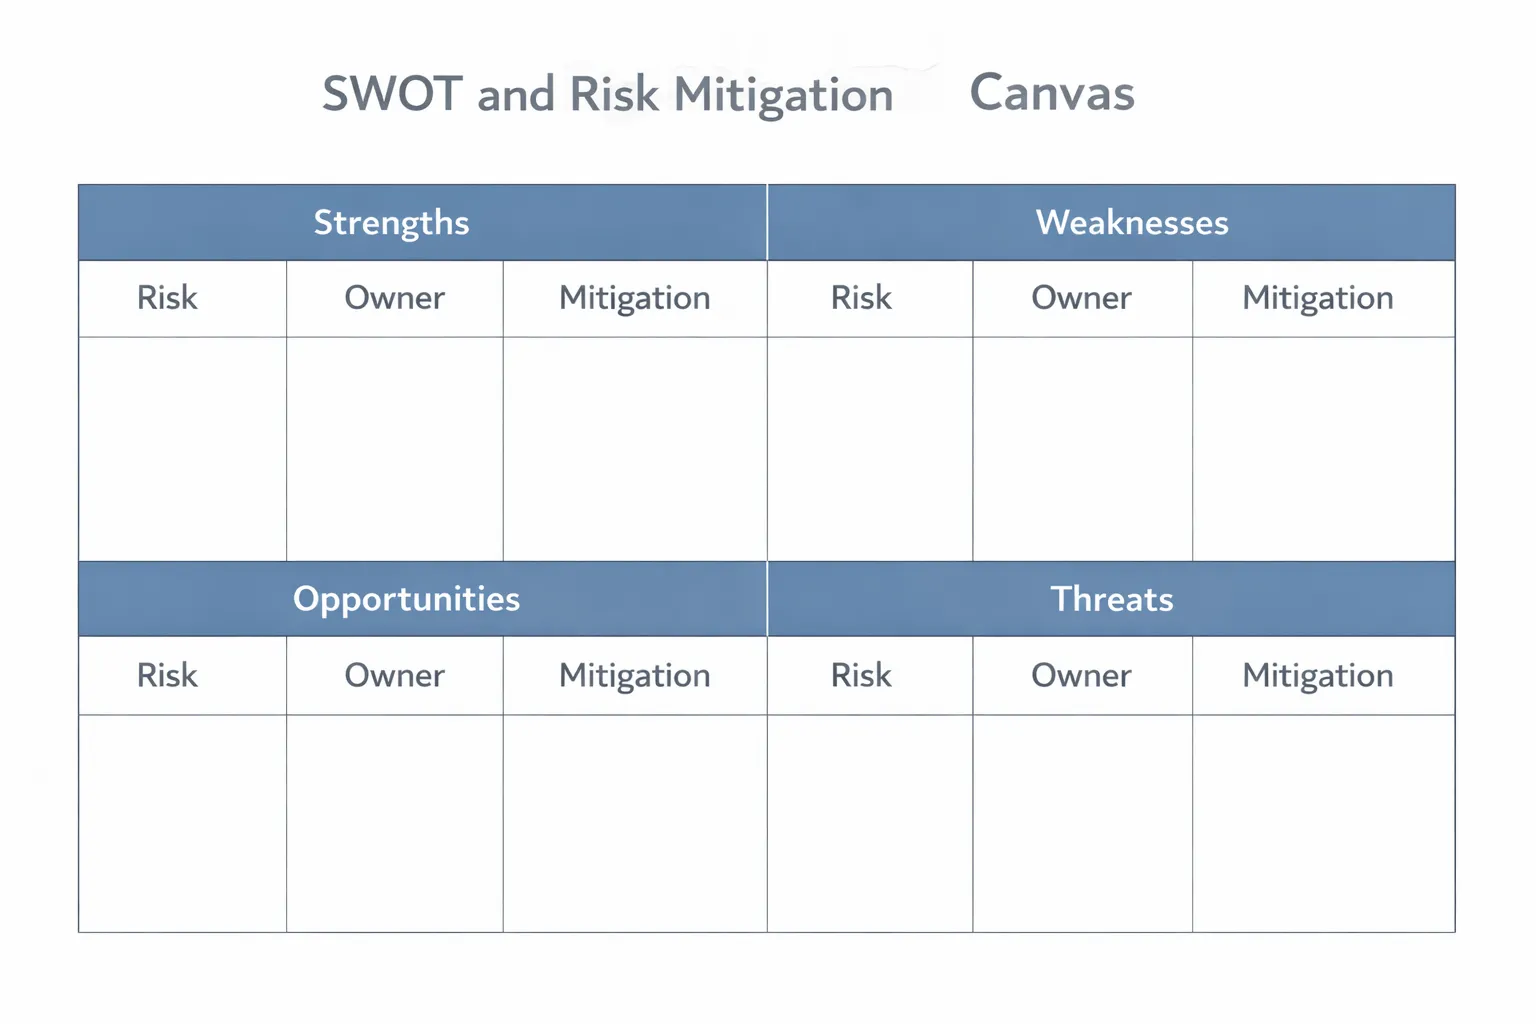
For each identified risk, the team documents an owner, a mitigation action, and a timeline. If a risk can’t be mitigated, it gets named explicitly. That naming discipline matters.
A project with no documented mitigation for regulatory exposure or cybersecurity liability should not advance to execution. The canvas forces that gap to surface before heavy capital is deployed.
The cost of running this canvas is low. The cost of skipping it, and discovering a fatal operational flaw mid-execution, is not.
5. Value Stream Canvas
When to use: Late-stage pre-integration reviews.
A concept can be technically sound and still fail in deployment.
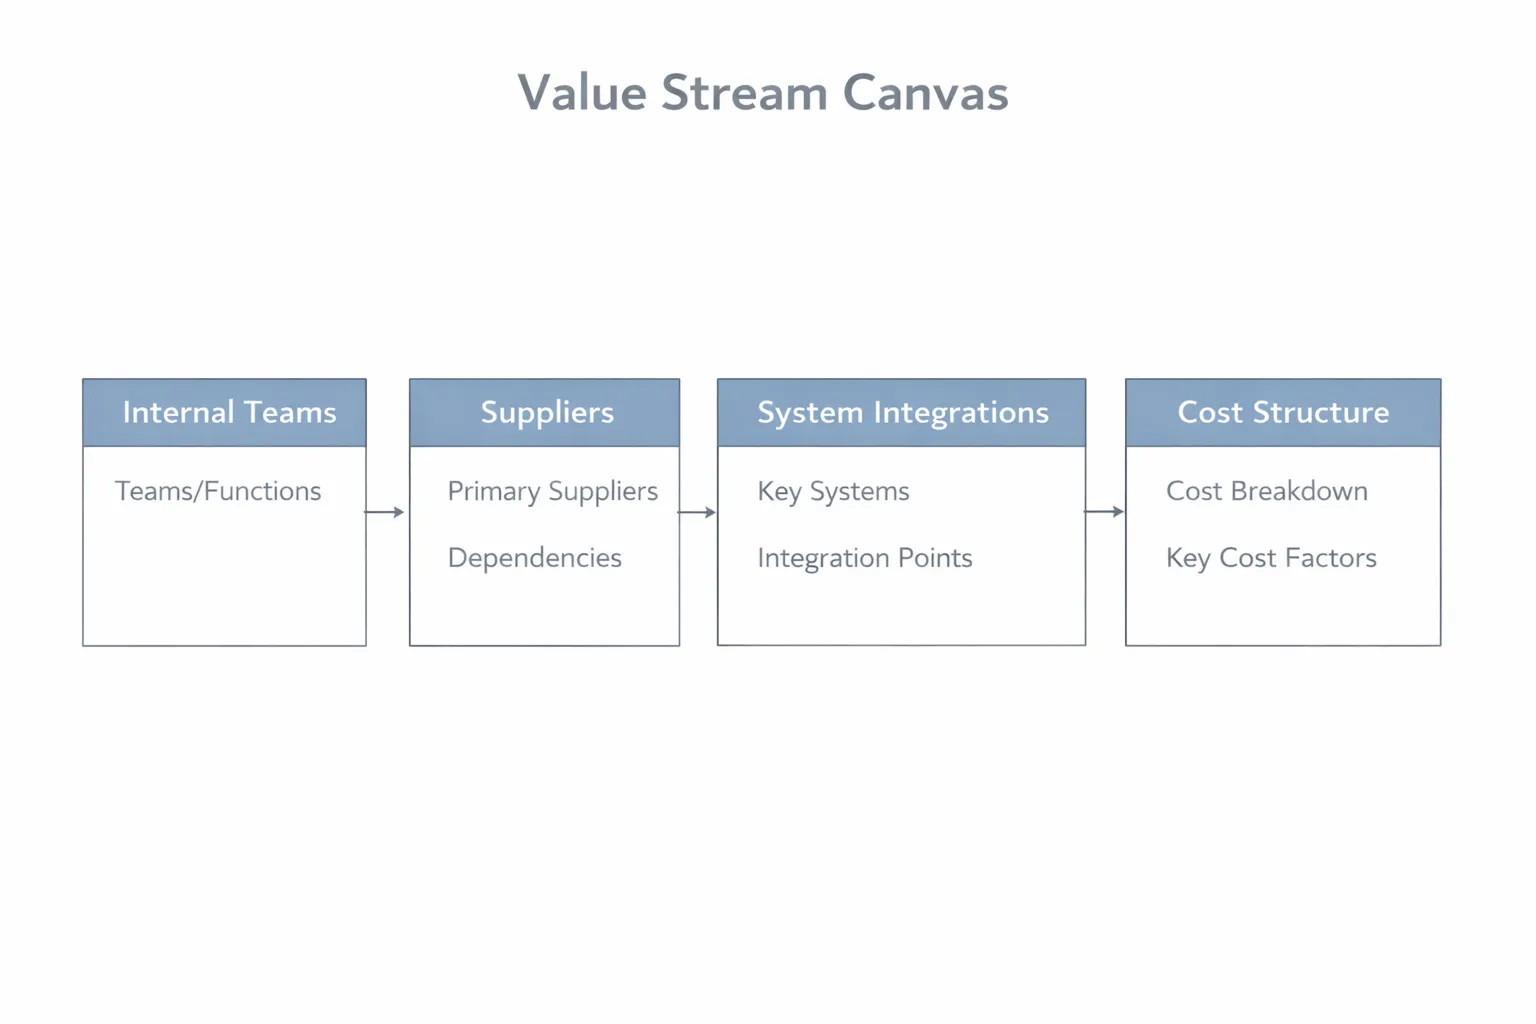
It captures the logistics of delivery: which internal teams are involved, which suppliers are required, what system integrations are needed, and what the long-term cost structure looks like.
If a breakthrough product requires integration with three legacy systems, each with a six-month approval cycle, the canvas surfaces that constraint before a full investment commitment.
R&D and operations teams have to reconcile their assumptions before scaling begins, rather than after a product launch exposes the gaps.
6. Problem Statement Canvas
When to use: Pre-ideation, and initial concept pitching.
This canvas addresses the most common innovation failure: building a technically excellent solution to a problem that customers don’t actually have, or don’t have urgently enough to pay for.
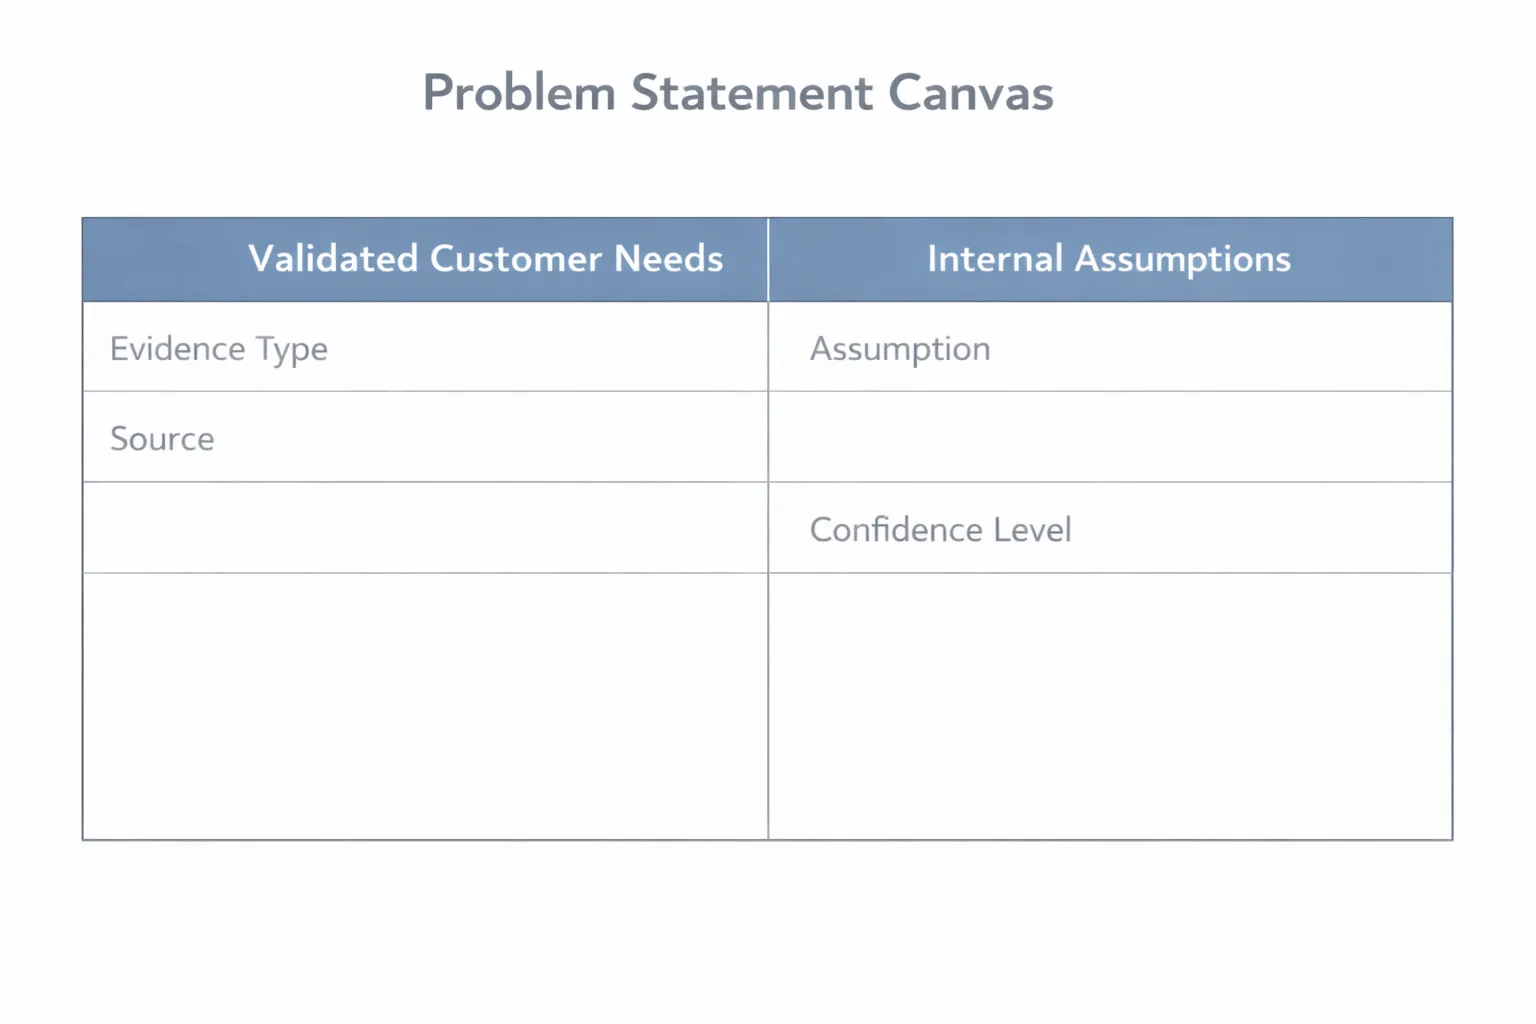
The problem statement canvas documents validated customer needs against internal assumptions.
If the canvas is filled with hypotheses and no customer data, the committee withholds development funding. The team runs structured customer interviews, then returns.
Getting the problem definition right is what separates innovations that land from innovations that stall.
Validating at this stage is cheap. Validating after twelve months of development is not.
| Canvas | Primary Focus | Best Used During | Key Output/Metric |
|---|---|---|---|
| Strategic Alignment | Objective mapping and portfolio filtering | Initial intake; quarterly reviews | Clear strategic lever per project |
| Innovation Ambition Matrix | Portfolio balance across risk zones | Annual planning; macro rebalancing | % allocation by innovation type |
| Project Status | Real-time evidence and confidence tracking | Monthly/bi-weekly gate reviews | Confidence score; evidence inventory |
| SWOT & Risk Mitigation | Risk documentation and ownership | Pre-execution; pre-scaling gates | Named risks; documented countermeasures |
| Value Stream | Operational delivery feasibility | Late-stage pre-integration reviews | Integration complexity; time-to-market assessment |
| Problem Statement | Validated customer need documentation | Pre-ideation; concept pitching | Evidence quality; assumption inventory |
How to Run Canvas Reviews That Work
A standard canvas format is the foundation. How you run the review determines whether it produces better decisions or just better paperwork.
| Practice | How It Works | Why It Matters |
|---|---|---|
| VC mindset on capital | Release funding in tranches tied to Confidence Score thresholds. A project earns its next sprint by moving the score. | Removes the illusion of certainty from early-stage investment. The committee reassesses when scores stall, not at year-end. |
| Culture of early kills | Reward teams that surface failing projects at month three. The organizational incentive to raise bad news early must outweigh the pressure to hide it. | A team that kills at month three saves far more than one that protects a struggling project to month eighteen. |
| Innovation Shelf | When a project is paused (wrong timing, unready technology), archive the canvas in a structured system rather than discarding it. | Turns “not now” into a real option. When conditions shift, that canvas is ready to revive quickly. |
A weak Confidence Score isn’t a rejection. It’s a prompt: what experiment would move it? What evidence would matter most right now?
The committee adds value by helping a team de-risk, not just approving or rejecting their current state.
What Standardization Actually Delivers
The results from organizations that have adopted structured portfolio governance are well-documented:
- High-performing organizations waste 21 times less budget on failed projects than underperformers. The differentiator is governance rigor, not execution effort.
- Up to 30% of innovation investment is wasted not from poor execution, but from poor portfolio selection.
- Teams applying criteria-based evaluation achieve 27% lower failure rates than those without defined decision criteria.
These outcomes come from the same structural shift: moving from subjective, presentation-dependent reviews to objective, evidence-based evaluation.
When every project is assessed against identical criteria, portfolio decisions improve. Standardized canvases produce structured data, and structured data is what makes AI-assisted portfolio review possible.
That’s where the 25-30% faster implementation of innovation projects, which structured funnel governance enables, becomes achievable.
Start With One Canvas, at Your Most Critical Gate
The six canvases don’t need to be implemented simultaneously.
Start with the gate that matters most in your current process, usually the point where you move from early exploration to resource commitment, or from validation to execution.
Choose the canvas that addresses your biggest decision gap at that gate. Run it for two months.
See what the structured data reveals that your previous process was missing.
Then add the next canvas. The value compounds as the framework becomes consistent across your entire portfolio cycle.
Download our free ebook Project Portfolio: From Opportunities to Value and learn how to spot bottlenecks and make decisions based on signals instead of spreadsheets.
Request a demo to see how Accept Mission gives you real-time visibility into WIP aging, queue depth, and throughput with dashboards built for portfolio governance.








 English
 Dutch
Dutch Portuguese
 Spanish
 French
 German
 Arabic