
Prioritization Beyond ROI: Scoring Ideas When Data Is Uncertain13 min read

Your innovation team just spent two weeks building financial projections for a new product concept.
The spreadsheet is crisp:
- 3-year ROI of 240%
- Payback in 18 months
- Addressable market of $50M
It looks bulletproof so you fund it. Eighteen months later, you’re writing it off. This happens more than most leaders care to admit, and it’s a symptom of a broken evaluation process.
Early-stage ideas don’t have reliable financial data, yet most scoring methods pretend they do.
Teams end up reverse-engineering spreadsheets to justify pet projects, or abandoning structure altogether and letting the loudest voice win.
But there’s a third path:
One that works specifically for innovation managers and R&D leaders who need to make defensible investment decisions without reliable data.
Weighted scoring models paired with confidence factors that make uncertainty visible, measurable, and actionable, so investment levels match what you actually know.
Why ROI Fails for Early-Stage Ideas
ROI works beautifully when you have historical data.
If you’re launching your fifth e-commerce warehouse in a market where you’ve already built four, projecting costs and returns is relatively straightforward. You have precedent.
Early-stage ideas live in a different world.
Economists have a term for it: Knightian uncertainty, where outcomes can’t be reliably estimated from past experience.
When a founder writes “20% market penetration in year three” into a business case, that’s not a forecast. It’s a guess dressed up in decimal points. And everyone in the room knows it, even if nobody says so.
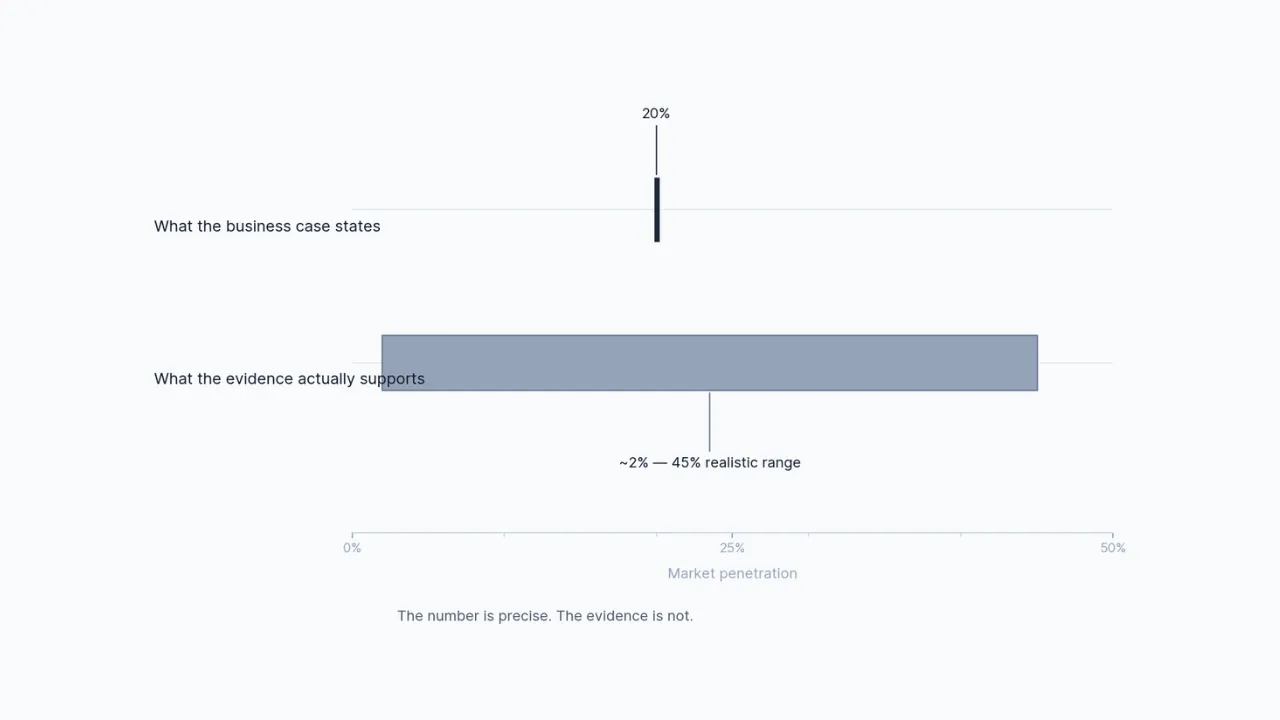
Yet that’s exactly what gets plugged into ROI models.
Teams either manufacture specificity (or worse, they’re pressured to by stakeholders expecting a number) or they abandon structured evaluation and fall back on gut feel and hierarchy.
And the costs add up fast.
70% of digital transformation initiatives fail to meet objectives, largely due to execution gaps but also because investments were prioritized based on inflated financial projections.
Organizations lose an average of $9.7-15 million yearly through flawed decision-making caused by poor data quality, which cascades through the entire portfolio.
Consider Zillow’s iBuying experiment.

The company built a sophisticated algorithmic model to estimate home values and scale residential real estate investment. The ROI math looked compelling.
But the model failed to account for unstructured data, behavioral shifts during market volatility, and cascading costs from pricing errors. The result: over $500 million in losses and a 25% workforce reduction.
The underlying failure: nobody quantified what they didn’t know.
The financial model created false precision in a domain where high uncertainty should have shaped the investment strategy from the start.
A confidence-adjusted approach would have flagged the gap between the model’s specificity and the team’s actual evidence base.
The Biases That Break Scoring
Even teams that move away from pure ROI often still fall into predictable traps. Structured scoring models are only as good as the humans running them. And humans bring biases.
False Precision
When a scoring model asks for a numerical rating, people comply. Someone rates “market potential” as 7.2 out of 10. Another rates it 7.8. The difference feels meaningful.
Teams will spend time debating whether 7.2 or 7.8 better captures the opportunity. Meanwhile, they’re treating estimates made with very little evidence as if they’re accurate to one decimal place.
Research shows that converting qualitative, highly uncertain judgments into precise decimal scores leads to information loss and false precision.
The confidence that precision implies doesn’t match the underlying reality.
A score of 7.2 suggests you know something specific. If that number is based on a single conversation with a potential customer, you probably don’t.
The HiPPO Effect
HiPPO stands for “Highest Paid Person’s Opinion.” It’s what happens when organizational hierarchy interferes with data-driven evaluation.
The VP of Product walks into the scoring session with a favorite idea. Even if the data suggests it’s weak, the team adjusts their scores upward because they’ve learned, over time, what the VP wants to hear.
Teams playing this game learn which criteria to exploit, transforming prioritization debates into arguments over subjective assessments.
Zombie projects that continuously consume budget despite weak performance persist because canceling them requires going against organizational power.
Allowing the highest paid person’s opinion to override data leads to projects that drain resources indefinitely.
Anchoring and Gaming
The first person to speak in a scoring session sets an invisible anchor.
Everyone else’s estimates cluster around that number, even if they’d judge the idea differently in isolation. Research on estimation shows the first speaker can skew results by up to 67%.
Teams also learn to game the system.
If you know that ideas scoring above 7.0 move forward and below 5.0 get killed, you learn which criteria are “easy” to score high and which ones are gatekeepers.
Pet projects get inflated scores on the criteria where the bar is lower.
| Bias | How It Distorts Scoring | Structural Countermeasure |
|---|---|---|
| False Precision | Treating estimates as accurate to one decimal place when underlying data is sparse | Introduce confidence tiers; acknowledge that different scores warrant different levels of evidence |
| HiPPO Effect | Authority silences data; zombie projects persist because they’re politically safe to fund | Independent scoring before group discussion; surface confidence to override opinion hierarchy |
| Anchoring | First speaker sets invisible ceiling/floor for everyone else | Collect scores individually before revealing them; rotate who presents first |
| Gaming | Teams learn which criteria are “easy” and inflate scores accordingly | Vary criteria weights; regularly audit for score inflation on the same team’s ideas |
The good news: these biases aren’t unsolvable. They’re solvable if you build safeguards into your process.
Weighted Scoring Models That Account for Uncertainty
Most innovation teams have seen a weighted scoring model at some point. The question is whether the model they’re using actually accounts for what the team doesn’t know in innovation management.
RICE (Reach, Impact, Confidence, Effort) is the most widely adopted prioritization framework at 38% of product teams.
RICE multiplies Reach (how many users) by Impact (how much each user benefits) by Confidence (the team’s conviction level, typically expressed as a percentage) and divides by Effort.
The Confidence multiplier is the key insight: a high-impact idea rated with 50% confidence gets cut in half compared to the same idea rated with 100% confidence.
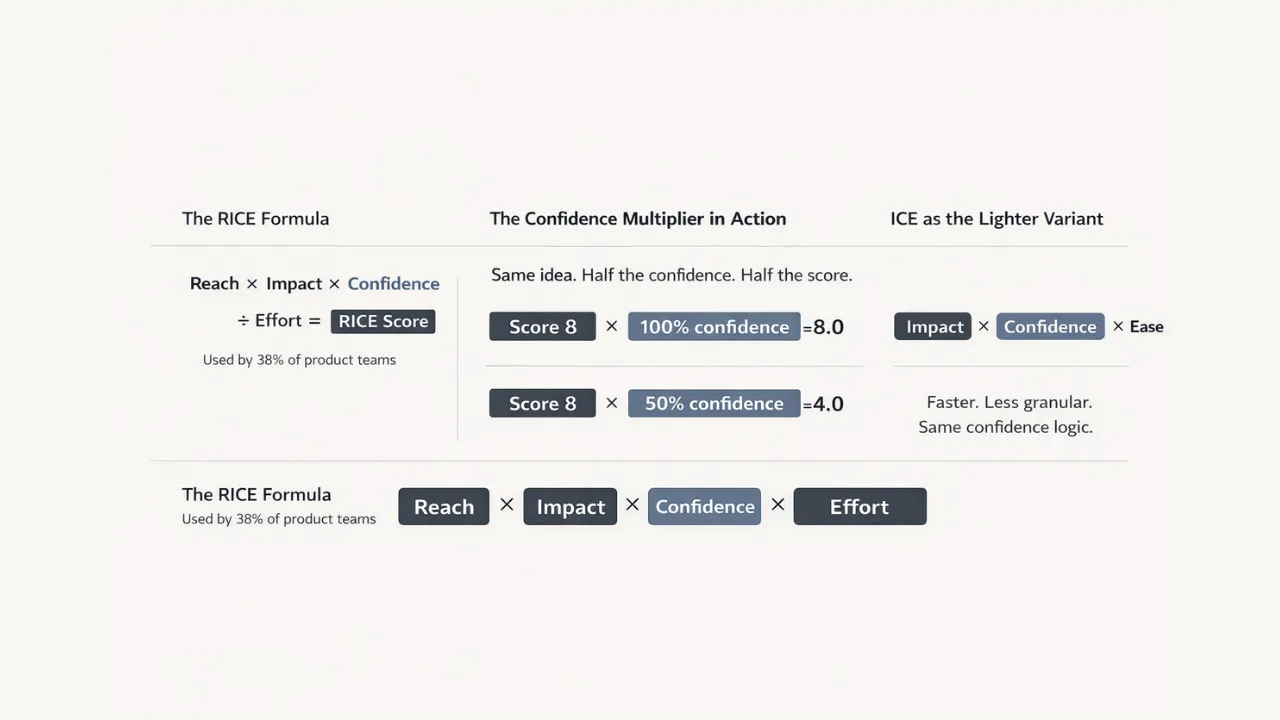
This prevents low-confidence guesses from dominating the portfolio.
ICE (Impact, Confidence, Ease) follows a similar logic, prioritizing speed and simplicity. It’s useful for teams that need fast decision cycles but can afford some loss of nuance.
Strategyzer’s evidence-based innovation scorecard replaces opinion-driven pitching with evaluation across four dimensions: Desirability, Feasibility, Viability, and Adaptability.
The real value lies in forcing teams to gather evidence for each dimension and acknowledge what they don’t know.
WSJF (Weighted Shortest Job First) and Cost of Delay are powerful in environments where speed-to-market and competitive timing matter.
But for early-stage ideas where demand is uncertain, these frameworks can oversell time-critical benefits that may not materialize.
| Framework | Best For | How It Handles Uncertainty | Limitation |
|---|---|---|---|
| RICE | Product prioritization with diverse portfolio | Confidence multiplier reduces inflated scores | Can hide low-confidence on individual dimensions |
| ICE | Speed and simplicity; fast decision cycles | Confidence multiplier; easy to apply | Doesn’t separate desirability from viability |
| Strategyzer Scorecard | Innovation with evidence gathering | Forces explicit evidence mapping | Requires discipline; can become process-heavy |
| WSJF / Cost of Delay | Speed-to-market critical; portfolio management | Addresses timing; multiplier effect | Assumes demand certainty not appropriate for early stage |
Each of these is better than pure ROI for early-stage ideas.
But they all share a limitation: they treat confidence as a single multiplier rather than interrogating what kind of evidence backs each score. That’s where confidence factors come in.
The Confidence Factor: Anchoring Scores to Evidence
Ask any team member “How confident are you in that score?” and you’ll get an answer. But confidence itself is subjective. One person’s 60% confident is another person’s 80%.
Itamar Gilad’s Confidence Meter solves this by mapping ideas to a spectrum of evidence, ensuring that investment levels stay proportional to validated learning.
Instead of asking “How confident?” ask “What evidence do we have?” and let the evidence type determine the confidence tier.
Think of it this way: a score of 7 out of 10 means something very different depending on how you arrived at it.
Is it based on one off-the-cuff conversation with a potential customer? Data from a market research report? Validated results from a paying beta customer? Or internal opinion?
The score should reflect the evidence type.
| Confidence Tier | Evidence Type | Example | Score Multiplier |
|---|---|---|---|
| Opinion | No customer contact; internal brainstorm only | “We think enterprise buyers will love this” | 0.4x |
| Thematic Support | Customer conversations; qualitative feedback; industry reports | “Five potential customers mentioned this problem in discovery calls” | 0.6x |
| Market Data | Market research; TAM estimates; competitor analysis; surveys | “Gartner reports 40% of enterprises cite this as a pain point” | 0.8x |
| Validated Results | Beta customers; pilot results; historical precedent | “Three beta customers are paying for this; usage metrics show adoption” | 1.0x |
Here’s how this works in practice: Two ideas both score 7.5 on “market potential” in your weighted model. Without confidence factors, they’re treated as equals.
But one is backed by extensive beta customer feedback. The other is based on internal intuition. The confidence-adjusted scores reveal the real difference: 7.5 x 1.0 = 7.5 versus 7.5 x 0.4 = 3.0.
Confidence adjustment doesn’t penalize early-stage ideas. It clarifies where they stand.
An idea that scores 3.0 after confidence adjustment isn’t dead. It’s in the exploration phase. It needs research. The next phase of work is gathering evidence to move it from Opinion to Thematic Support.
68% of enterprises integrate strategic fit assessment into financial analysis using weighted scoring, and this correlates with 29% higher long-term value creation.
The organizations doing this best don’t hide uncertainty behind decimal points in portfolio management. They surface it. You can even bridge this to financial governance by calculating confidence-adjusted expected value.
If an idea has a potential value of $10M but is backed by only 40% confidence (opinion-tier evidence), the expected value for planning purposes is $4M.
This gives CFOs the numerical anchor they want while grounding it in realistic probability.
Putting It Into Practice: A Governance Model
Confidence-adjusted scoring works best when it’s paired with a clear governance structure that acknowledges different stages of idea maturity.
Separate Your Portfolios by Horizon
Stage-Gate processes are adopted by roughly 80% of North American enterprises and increase product success rates to 63-78% compared to 24% without formal processes.
But traditional stage-gate thinking breaks down for early-stage innovation. Instead, think in terms of horizons.
Horizon 1 ideas are incremental improvements to existing products and business models.
Here, historical data exists. ROI-based scoring makes sense. You can project with reasonable accuracy because you have precedent.
Horizon 3 ideas are exploratory and transformational.
You’re entering new markets, testing new business models, or developing new technologies. Here, confidence-based scoring is mandatory.
ROI projections are fiction. What matters is evidence of desirability, feasibility, and the rate at which you’re gathering validated learning.
Horizon 2 sits in the middle. Some data exists, but it’s incomplete. Weighted scoring with confidence factors works well here.
Meter Funding by Confidence Level
This is where governance becomes operational. Budget allocation should follow evidence, not just opportunity size.
| Stage | Confidence Range | Budget Per Idea | Goal |
|---|---|---|---|
| Exploration | Opinion to Thematic Support (0.4x-0.6x) | $10K-50K | Answer a single critical question; gather evidence to move confidence tier |
| Validation | Market Data (0.8x) | $50K-250K | Run a pilot; test with real customers; validate unit economics |
| Scaling | Validated Results (1.0x) | $250K+ | Increase investment; prepare for commercial launch |
An idea scored with opinion-tier confidence doesn’t get million-dollar funding.
It gets ten grand to answer the next critical question. If the team gathers evidence and moves to thematic support, it graduates to the validation stage.
This forces discipline: you’re not betting the company on hunches. You’re investing in learning.
Spotify uses confidence scoring for GenAI financial automation, leveraging calibrator models and majority voting to ensure prediction accuracy.
The principle is the same: match investment to confidence level.
Celebrate the Kill Rate
Here’s a mindset shift many organizations need: early cancellation is capital saved, not failure. If you kill 50% of ideas after the exploration phase, that’s success.
You’ve avoided wasting resources on low-potential concepts.
Great ideas and bad ideas look virtually identical in early stages; success requires investing small amounts into many teams, then ruthlessly eliminating half based on lack of evidence.
That’s optionality. You’re buying the right to pivot, the information to decide, the evidence to commit.
Frame it this way internally: “We invested $30K to eliminate a bad idea. That decision just saved us $1.2M in wasted development and go-to-market spend.” Suddenly the kill rate is a positive signal.
Start Investing in Evidence, Not Hunches
The question that matters most in early-stage evaluation is “What’s the evidence?” ROI asks you to predict the future with precision you don’t have.
Confidence-adjusted scoring forces honesty about what you know and what you’re guessing.
For innovation managers, this means better portfolio balance and fewer surprises. For executives, it means capital flowing toward evidence instead of politics.
The good ideas get the runway they need, not based on who pitched them loudest, but based on what customers actually say in idea management.
Ready to stop losing good ideas to the wrong scoring criteria?
Download our ebook on building a confidence-adjusted scoring system, or book a demo to see how Accept Mission handles weighted criteria, evidence tiers, and portfolio prioritization.











 English
 Dutch
Dutch Portuguese
 Spanish
 French
 German
 Arabic