
Project Portfolio Management Tools for Innovation: The 6 Capabilities That Actually Matter16 min read

The tool got bought and the dashboards got built. Somebody still rebuilds the quarterly review deck by hand the night before.
Here’s the gap between what was promised and what shipped:
- A single portfolio view, accurate for roughly a week after each manual data pull.
- Faster gate decisions, still waiting on the one committee slot per quarter.
- Resource clarity that stops at headcount and never reaches who’s genuinely free in March.
- Executive reporting that gets exported, pasted into slides, and reformatted before anyone senior reads it.
None of that’s a procurement accident. Gartner found 56% of organizations regretting their largest tech purchase of the past two years.
The same Gartner research found those organizations took, on average, 7 to 10 months longer to complete the purchase.
The cost starts well before rollout.
Behind a lot of that sits a feature checklist standing in for a decision model. Six capabilities separate the tools worth shortlisting.
Why Innovation Portfolios Break Ordinary Portfolio Tools
Portfolio tooling largely grew out of delivery work. Scope is knowable, estimates converge, and finishing counts as winning.
Innovation portfolios diverge from that model at four points, and each one changes what the tool has to do:
- Estimates are unreliable by nature. Flyvbjerg’s 2006 analysis of transport forecasts found rail passenger demand arrives at barely half of forecast on average, with 84% of rail projects wrong on demand by more than ±20%. If forecasts miss that widely in an industry with decades of comparable projects, an early-stage innovation estimate has no reason to be tighter.
- Stopping is a success state. Gate governance recognizes four outcomes rather than two: go, hold, recycle, and kill. Killing and parking have to be cheap, fast, and blameless.
- Projects aren’t comparable across horizons. Nagji and Tuff’s 2012 HBR analysis put outperformers at roughly 70/20/10 across core, adjacent, and transformational work, with returns following close to the inverse ratio. One hurdle rate flattens all of that.
- Capacity is the binding constraint. Under Little’s Law, work in process and cycle time move together at a given throughput, so approval without capacity relocates the queue instead of clearing it.
Each of those four differences puts a specific demand on the tool:
| What Delivery Portfolios Assume | What Innovation Portfolios Actually Do | What That Demands From the Tool |
|---|---|---|
| Estimates converge over time | Estimates stay wide for months | Ranges and confidence, not single scores |
| Completion equals success | Stopping is often the best outcome | Kill and hold as first-class states |
| One hurdle rate fits all | Horizons pay back on different clocks | Segmentation before aggregation |
| Budget is the constraint | People and attention are the constraint | Capacity visible at the decision point |
Read the third column as a shortlist filter. A gap there is architecture, not configuration.
A ±20% miss doesn’t shrink because a tool needs a single number. Rendering a wide estimate as a precise figure manufactures false confidence.
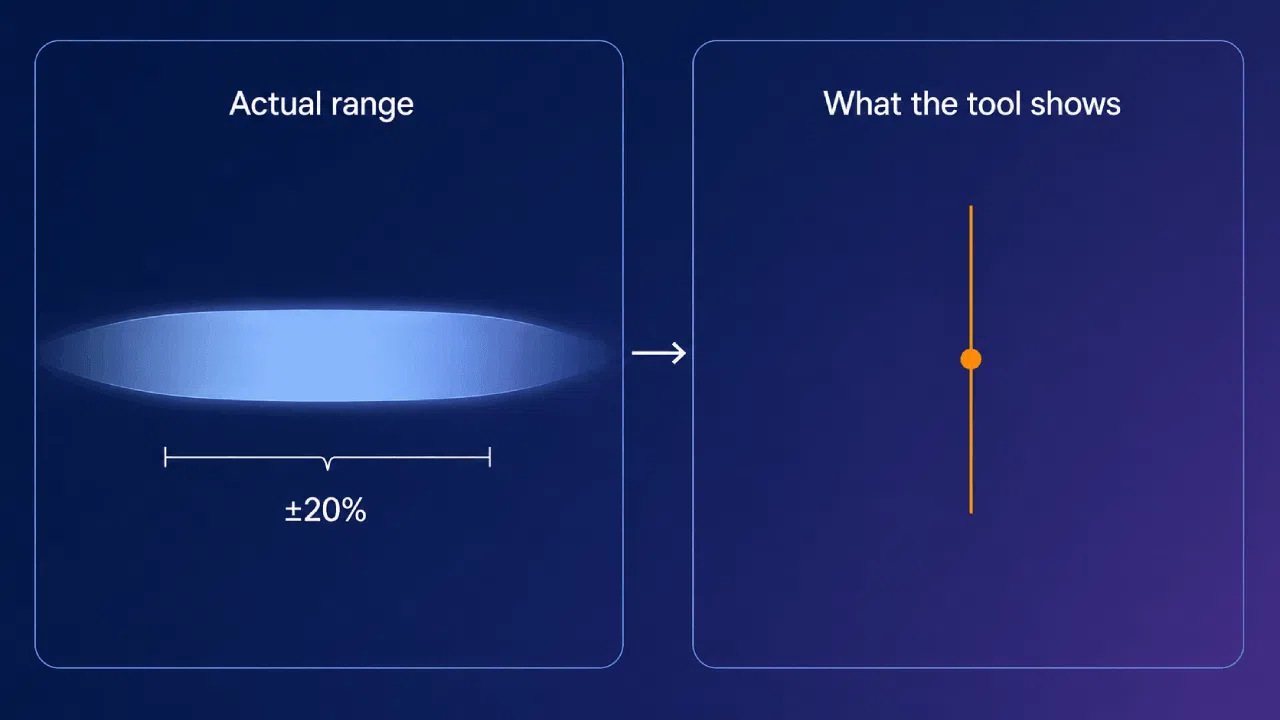
The precision is an artifact of the interface, and the room reads it as evidence. These demands don’t travel together, so check all four rows before you shortlist.
Two more capabilities sit outside those four and still separate tools. The rest splits into table stakes and things you shouldn’t pay for at all.
Start From the Decisions, Not the Feature List
A feature checklist rewards breadth, so it reliably produces a long list of capabilities nobody in your organization has a use for.
Start with what the decisions already cost. McKinsey’s 2019 survey of more than 1,200 managers isn’t flattering:
- 61 percent of managers say at least half the time spent making decisions is ineffective.
- Respondents who called decision making fast were 1.98 times more likely than others to rate those decisions high quality.
- Wasted decision time could run to roughly 530,000 days of managers’ time a year at a typical Fortune 500 company.
The filter that works is narrower than any feature list. Name the recurring portfolio decisions the tool has to make cheaper:
- Advance, hold, or recycle a project at a gate, usually on partial evidence and a fixed date.
- Kill a project and release its capacity to something with better odds.
- Reallocate people mid-quarter when priorities move underneath a committed plan.
- Rebalance the mix across core, adjacent, and transformational work.
- Report portfolio status to the board without rebuilding the view by hand.
Those five decisions repeat every quarter, and their real cost is the time spent reaching an answer the room will accept.
Anything the tool does outside those five, table stakes aside, is decoration, and you renew the decoration alongside everything else.
For each capability on the shortlist, name the decision it serves, its owner, and its cadence. Tools amplify whatever discipline already exists.
Bain’s RAPID roles are a quick way to test that ownership, since a decision with four owners has none. A capability mapping to no decision is a cost.
The 6 Capabilities That Actually Matter
Four of the six answer the differences above. The other two cover decisions nobody can reconstruct and reports nobody can refresh:
| Capability | The Decision It Serves | Ask For It in the Demo |
|---|---|---|
| Four-outcome gates | Go, hold, recycle, or kill at a gate | A hold, and what it frees up |
| Scores with confidence bands | Advance on partial evidence | A score from six months ago |
| Capacity at the approval screen | Reallocate people mid-quarter | Who goes over capacity next month |
| A segmented portfolio view | Rebalance across horizons | This quarter’s mix beside last year’s |
| A durable decision record | Kill, and make it stick | A project killed 18 months ago |
| Reporting that refreshes itself | Report to the board | The refresh schedule and its sources |
The order matters less than the coverage. A tool strong in five and blind in one still fails at the decision it can’t see.
Each one maps to a decision and a demo test, and each carries the failure mode that shows up when a tool skips it.
1. Gates That Support Four Outcomes, Not Two
A gate modeling only advance or reject collapses a real decision into a binary. All four outcomes should behave differently downstream:
- Go. Funds the next stage and books the capacity to match.
- Hold. Leaves the funding reserved against a dated review, and releases the team now.
- Recycle. Sends the project back a stage with a named owner, a deadline, and a written list of the evidence the gate lacked.
- Kill. Releases the budget and the people, and closes the project without closing the record.
Without downstream effects, a hold is a stalled record and a recycle is rejection with paperwork. The portfolio fills with work that’s neither dead nor moving.
The demo question: hold this funded project for one quarter, then show me exactly what changed on the capacity view.
Watch what those transitions actually do. A tool can display four buttons and still route three of them to the same dead end.
2. Scores That Carry Their Own Uncertainty
A score without a confidence band is a number pretending to be evidence. Three things should travel with every rating:
- The range it sits in, so nobody can quote the midpoint on its own.
- The assumptions it rests on, written where reviewers can actually see them.
- The evidence behind each one, linked rather than summarized by hand.
Discovery-driven planning treats assumptions as the unit of work, documented up front and tested at checkpoints. The tool should carry those checkpoints.
The failure mode’s a stale score. It updates when someone remembers to open the record, months after the assumption broke.
AI earns its place here as a consistency check, so ask a vendor to show it flagging two reviewers who diverge sharply on the same criterion.
The demo question: show me a score from six months ago. The range, the assumptions, and the linked evidence should all still be attached.
3. Capacity Visible at the Moment of Approval
The approval screen has to show who’s already loaded and until when. Approving work without that view just moves the queue somewhere less visible.
Resource planning is where a lot of setups quietly fall back to spreadsheets, and Wellingtone’s 2019 survey put 44.3% of organizations on Excel for it.
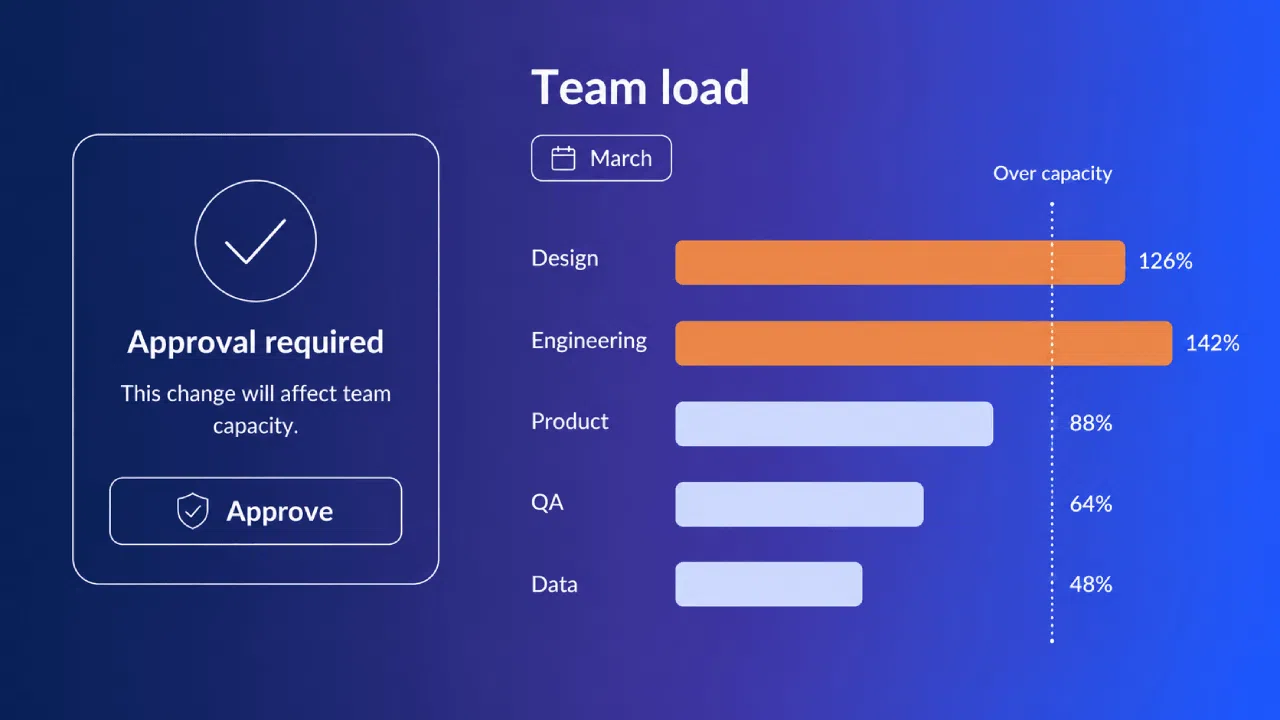
The demo question: approve this project, then show me everyone who goes over capacity next month, and by how much.
The failure mode is familiar. Everything gets approved, and the real priority order gets set by whoever pushes hardest in the corridor.
4. A Portfolio View That Segments Before It Sums
A single blended ROI figure spanning every horizon is worse than no figure at all. It’s arithmetic performed on categories that don’t share a clock.
So the view has to segment before anything gets aggregated into a headline number:
- By horizon, so core, adjacent, and transformational work never share a hurdle rate.
- By stage, so a backlog of ideas can’t read as a pipeline of funded projects.
- By risk class, so the safe bets don’t crowd out everything else.
The view should also answer whether the mix is drifting toward core work, and by roughly how much each quarter.
Failure mode: transformational bets get judged against core payback periods. They starve quietly while everyone still agrees they matter.
If 40 raw ideas sit on the board’s view untriaged, next to two funded projects, that’s a selection problem, not a dashboard problem.
Ask to see this quarter’s mix beside last year’s, split by horizon, with no export to a spreadsheet in between.
5. A Decision Record That Outlives the People Who Made It
A decision with no written trace gets made again from scratch a year later. The record has to hold what the room knew on the day:
- The rationale, in the words of whoever actually made the call.
- The criteria in force at the time, which rarely match today’s.
- The dissent that got overruled, and the person who raised it.
McKinsey reported in 2017 that 72 percent of senior executives saw bad strategic decisions as about as frequent as good ones, or the prevailing norm.
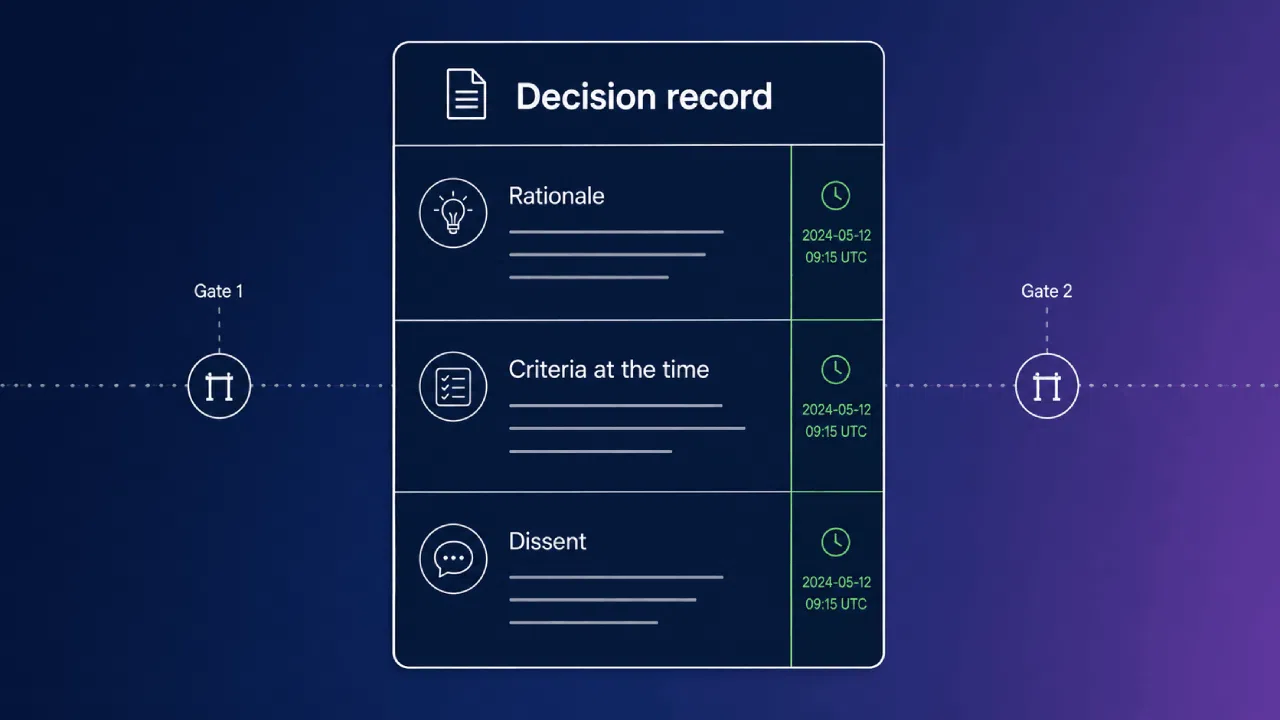
Nobody catches that pattern without a record. Memory alone won’t produce one.
The failure mode is re-litigation. The same idea returns every planning cycle because nobody can find why it was parked the first time.
Ask a vendor to show a project killed 18 months ago, with everything that was known on the day it died.
6. Reporting That Refreshes Without a Human
Board reporting should refresh on its own schedule. If a person assembles it by hand, it’ll be late, stale, or both.
Wellingtone’s 2026 survey puts 72% of people at half a day or more every month collating project reports by hand.
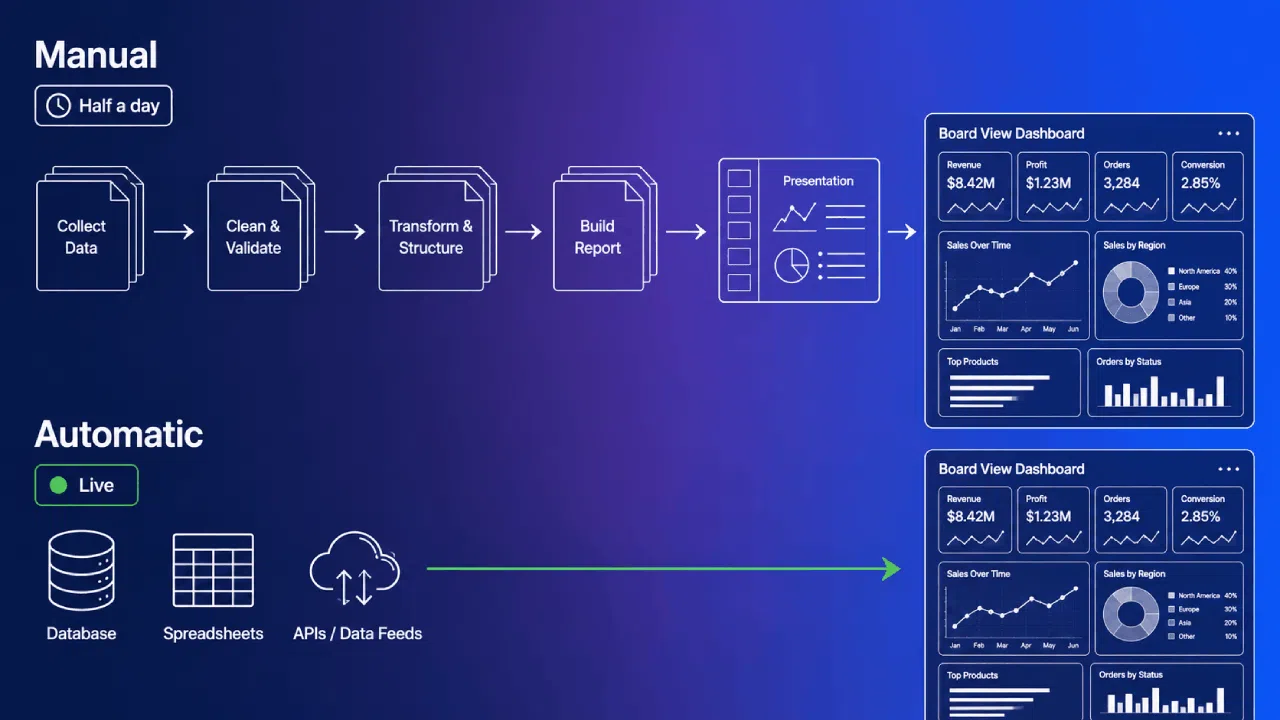
The failure mode’s a recurring half-day, spent rebuilding a deck that nobody fully trusts anyway.
The demo question here is blunt. Show me the refresh schedule, the sources behind it, and what breaks when one goes down.
The Table-Stakes Checks (Do These Fast)
The six above are where tools differ. These four are where a tool gets disqualified, well before pricing enters the conversation:
- Integration reality. Enterprises now run 957 applications on average, with only 27% integrated, so name the two systems you’ll actually connect and the person who maintains that connection.
- Security and access. In G2’s 2023 study, 86% of buyers said they leave InfoSec out of the purchase, citing pressure to deliver results quickly. Left out means found out late, usually with the timeline already spent. Bring InfoSec in early with three questions: which certifications are current, where the data is hosted, and how SSO and role permissions work.
- Admin burden. Name whoever will own fields, workflows, scoring models, and permissions, then ask how many hours a month that ownership realistically costs.
- Data portability. Ask for a full export of projects, scores, and decision history, in a structured format that still works after you leave.
Run all four early, well before anyone builds an internal business case around a favorite and starts defending it.
To be fair, none of the vendor-facing answers should be hard to give. The internal ones are yours to settle first.
Asking costs an afternoon, and skipping it costs a renewal cycle.
What Not to Pay For
A shortlist gets expensive at the edges, in the line items that map to no recurring decision:
- Unlimited configurability. Someone still has to design the process, and that someone’s you.
- Construction-grade dependency and Gantt depth. Innovation work seldom has a critical path stable enough to be worth modeling at that resolution.
- Full-price seats for occasional reviewers. They tax the exact behavior you’re trying to grow, so ask what a read-and-score-only user costs.
- Meeting recaps that never reach the record. A tidy summary sitting in a separate tool isn’t a decision record.
Configuration you buy now is maintenance you owe later.
The budget-level analogue is tech debt. CIOs told McKinsey that 10 to 20 percent of new-product technology budgets goes to resolving it.
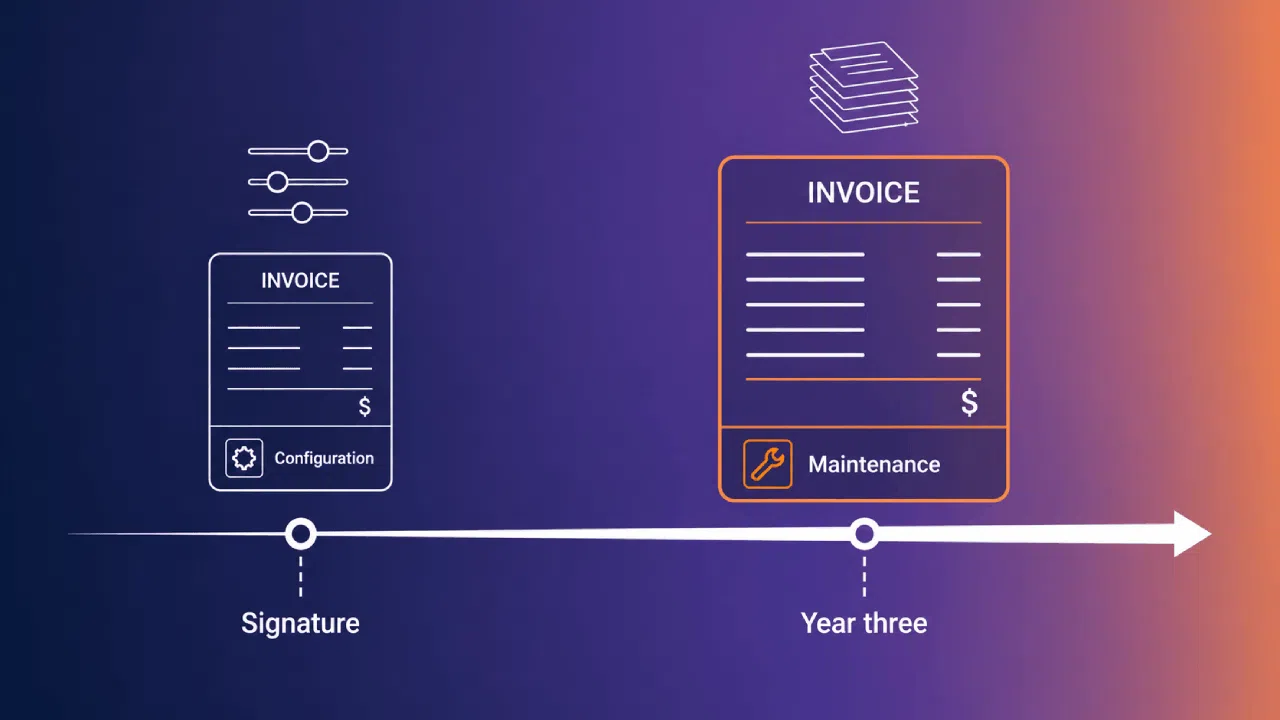
A heavily configured portfolio tool becomes a small internal product, with an owner, a backlog, a documentation gap, and a migration problem waiting at the other end.
Price that in at signature: approving the configuration budget approves the maintenance bill with it, one decision and two invoices.
Buy, Build, or Stay Where You Are
Three options stay live through any honest evaluation, and one of them is changing nothing at all. Self-assessment’s the weak link there.
PMI’s 2018 Pulse research put executive confidence next to delivery reality:
- 85% of executive leaders believe their organizations deliver projects effectively.
- 31% of projects don’t meet their goals.
- 43% run over budget, and 48% finish late.
So “we’re fine on spreadsheets” starts needing evidence rather than confidence. Here’s how the three options behave:
| Option | Wins When | Breaks When |
|---|---|---|
| Spreadsheets and BI | A portfolio one person can hold in their head | Gate state, capacity, and decision history need governing |
| Build internally | Unusual process, strong platform team, patient budget | The team that built it gets pulled elsewhere |
| Buy purpose-built | Recurring gate decisions across several horizons | Process discipline doesn’t exist yet |
The build row deserves the most scrutiny. The pattern to watch is a build that ships once, then loses its second release to competing priorities.
The buy row carries its own condition. A purpose-built platform imposes structure, and imposed structure lands badly in an organization where nobody owns the gate.
Keep expectations honest whichever you pick, because no tool moves the base rate as much as a vendor deck implies.
Across benchmarked firms, new product success sits near 59.6% over five years. The best firms hit 75.3%, everyone else 51.4%.
The spread between best and rest is nearly 24 points, and no tool closes that on its own.
Run the Evaluation Like a Portfolio Decision
Write the requirements before the demos get booked, the same way you would for delivery work. PMI’s 2014 research tied 47% of unsuccessful projects to inaccurate requirements management.
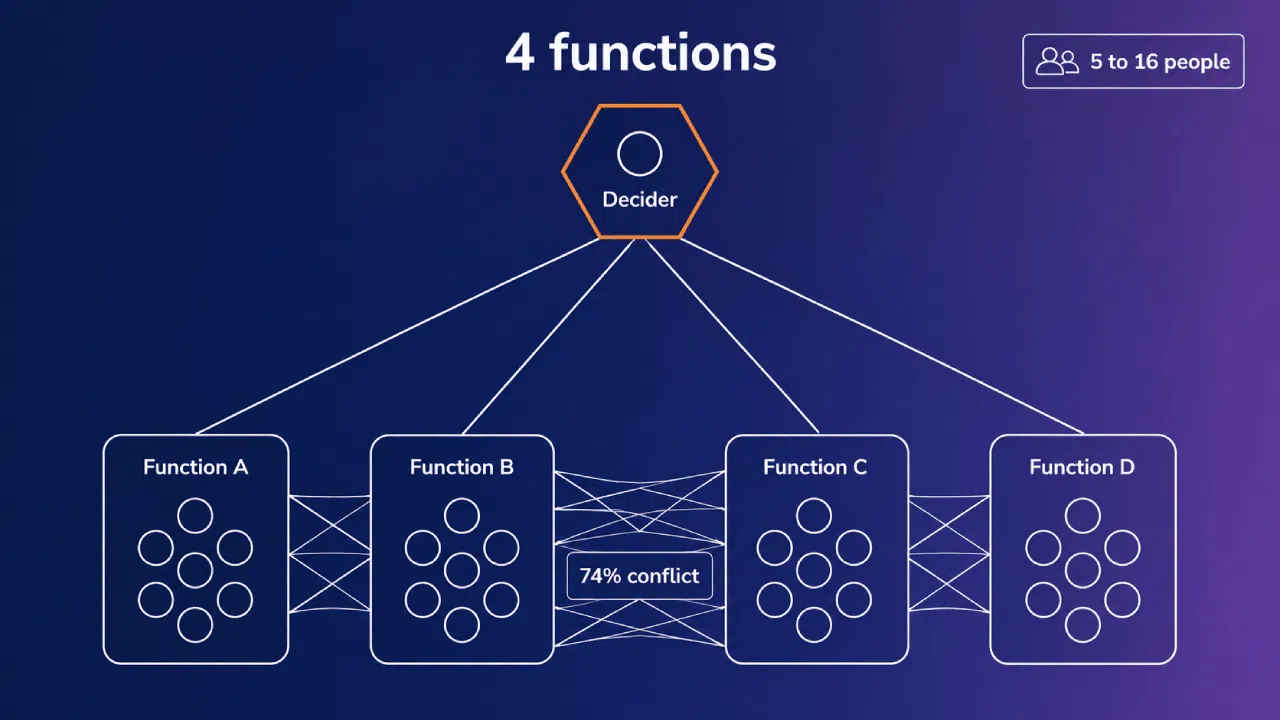
Name the decider before the first demo, and write down what each function is optimizing for. Alignment doesn’t happen on its own, and it won’t happen in the room.
Then make every vendor run five scenarios live, using your own portfolio data rather than the polished dataset they arrive with:
- Kill a funded project. Show where the money and the people go, and what the decision record looks like afterwards.
- Take an idea into a gate review with an incomplete business case. Show the hold and recycle paths with no offline workaround, then run the same idea down the go path and show who goes over capacity next month.
- Produce the board view with no manual step. Your own data, rendered live while the buying group watches.
- Add a reviewer mid-cycle. Show what happens to the scores already submitted, and whether each score keeps its range, assumptions, and linked evidence.
- Rebalance the mix live. Move funding from core to transformational, and show what the portfolio view does about it.
Buying groups run five to 16 people across as many as four functions, and 74% of those groups show unhealthy conflict during the decision process.
The requirements exist to shape the demos, not to score them. One live portfolio review beats any weighted matrix.
Close with a pilot time-boxed to a quarter that contains a scheduled gate meeting and one of those reviews. Agree the success criteria up front.
Get it in writing that the pilot data leaves with you, in the export format you asked about first.
Buy the Decision, Not the Dashboard
Six capabilities, and every one should trace back to a decision, an owner, and a cadence. Anything else is cost you’ll carry indefinitely.
So compress the whole evaluation down to four tests:
- The evidence test. Scores carry ranges, assumptions, and the evidence behind them, and the portfolio segments by horizon before anything gets summed.
- The stop test. Killing or holding a project is quick, blameless, and leaves a record behind.
- The capacity test. The approval screen shows who’s already loaded before anyone says yes.
- The refresh test. The board view rebuilds itself, with no person standing in the middle.
At portfolio level, decision quality sets the ceiling, because a pipeline with no kill discipline is only a longer queue.
Accept Mission reports roughly a 30% reduction in resource waste through data-driven scoring and group decision making.
Buy for the quarterly review you want to be running twelve months from now. Then check, in the demo and in the pilot, that the tool can survive it.
Download our free ebook Project Portfolio: From Opportunities to Value to learn how to build portfolio visibility that survives a real quarterly review cycle.
Request a demo to see how Accept Mission gives you gate decisions, capacity, and portfolio reporting in one source of truth your board can read.







 English
 Dutch
Dutch Portuguese
 Spanish
 French
 German
 Arabic