
What a High-Performing Idea Funnel Looks Like (With Examples)11 min read

Most organizations have an idea funnel. Most funnels don’t perform.
The gap is structural. You can fill a funnel with thousands of ideas, stack it with reviewers, and still watch 95% of submissions go nowhere.
High-performing funnels share four core traits:
- Clear gate criteria defined before evaluation starts
- Active kill decisions made with visible authority
- Consistent progression rates tied to stage definitions, not reviewer opinion
- Ownership that remains accountable through the entire lifecycle
Here’s what those funnels look like, and what broken ones look like alongside them.
What “High-Performing” Actually Means
Performance in an idea funnel is measurable.
High-performing funnels achieve a 78% success rate on structured innovation initiatives, compared to 63% for average implementers and just 24% for ad-hoc approaches.
That gap is significant: the difference between launching one successful product per five attempts and launching one per four. At scale, that compounds into hundreds of millions in value.
But the success rate alone misses the point. Here’s what really separates performing funnels from the rest:
- Stage progression rates that stay consistent: 30-50% of ideas advance from intake to screening, then 60-80% move through concept development to business case phases. No mysterious vanishing act.
- Kill rates that signal health, not failure: The best-run funnels show roughly 55% attrition per major stage. Discipline, not waste.
- Gate decisions that land in days, not weeks: Target under one week per gate. When decisions stretch into months, ideas decay and ownership evaporates.
- New product revenue contribution holding steady at 25-30% of total revenue: This is the ultimate denominator. Structure matters because it moves the needle on this one metric.
| Metric | Weak Funnel | High-Performing Funnel |
|---|---|---|
| Success rate | 24-35% | 75-85% |
| Ideas to implementation ratio | 50-100:1 | 15-25:1 |
| Average gate decision time | 3-6 weeks | 3-5 days |
| Stage progression rate (early) | <20% | 30-50% |
| Stage progression rate (late) | <30% | 60-80% |
| Ideas stalled >60 days | 40-50% | <10% |
| New product revenue % | <10% | 25-30% |
The Patterns High-Performing Funnels Share
The best-run funnels share four structural patterns. They’re not secret, but they’re enforced with discipline at every gate. Let’s look at each one.
Clear Gate Criteria, Set Before Evaluation Starts
High-performing funnels evaluate ideas against a rubric.
The rubric exists before the first submission lands. Every reviewer applies the same criteria across five core dimensions:
- Strategic fit and alignment with roadmap
- Technical feasibility and resource availability
- Customer desirability and market validation
- ROI potential and timeline to value
- Resource requirements and capacity constraints
The specific weighting shifts by stage.
Early-stage gates emphasize strategic alignment and novelty. Later gates prioritize ROI projections, risk exposure, and implementation readiness.
This matters because it eliminates the single biggest killer of innovation funnels: subjective, variable evaluation.
When criteria shift with the reviewer, ideas advance on personality, not merit. Predefined rubrics can’t eliminate bias, but they make it visible and correctable.
Gates are forward-looking, not backward-looking. There are two ways to frame a gate question:
- Backward-looking: “Has this idea progressed far enough?”
- Forward-looking: “Do we have enough confidence to commit resources to the next phase?”
The second question forces real decisions.
Active Kill Decisions, Not Just Passive Advancement
Ideas advance by default in broken funnels. In high-performing ones, they advance because someone explicitly decided they should: someone with authority to say no, who uses it.
HP runs roughly a 55% kill rate per major gate. Start with 10 ideas, you’re left with one moving toward implementation. The math is deliberate.
E.ON moved only 24 of 500+ ideas to implementation, a 4.8% rate.
Those 24 delivered measurable business impact. Suzlon collected 1,835 ideas across eight campaigns and implemented 18 innovations, a 200% increase over their baseline.
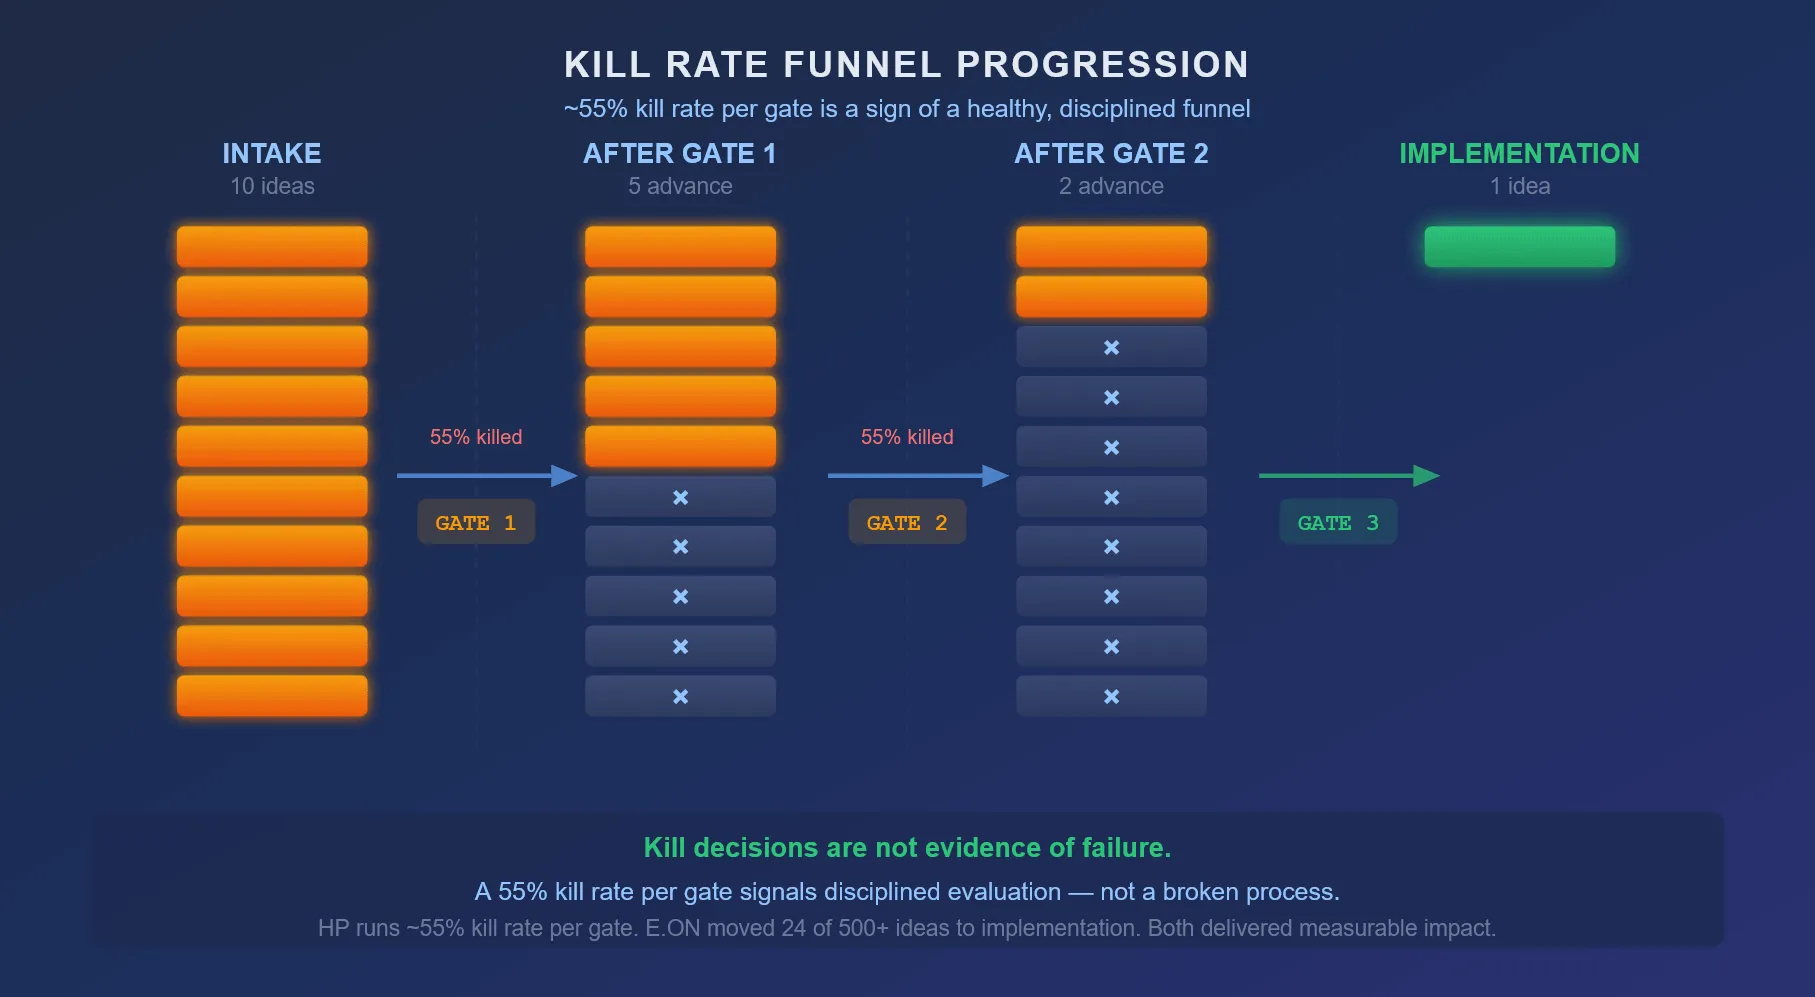
The kill decisions were the mechanism of success, not evidence of failure. Volume at the top matters only when the structure below it actually filters.
Go/Kill/Hold/Recycle frameworks enforce this discipline. “Recycle” is the option most teams miss. An idea might not fit today’s strategic priorities, but it fits tomorrow’s.
Recycling prevents both premature death and zombie ideas that never quite die.
Structured Volume at the Top, Rigorous Validation Downstream
High-performing funnels start wide. Open intake at the top is intentional.
Organizations that sustain 100+ ideas per quarter in intake consistently outperform those with tighter early-stage filters. A wider pool improves the odds of finding breakthrough ideas, not just incremental ones.
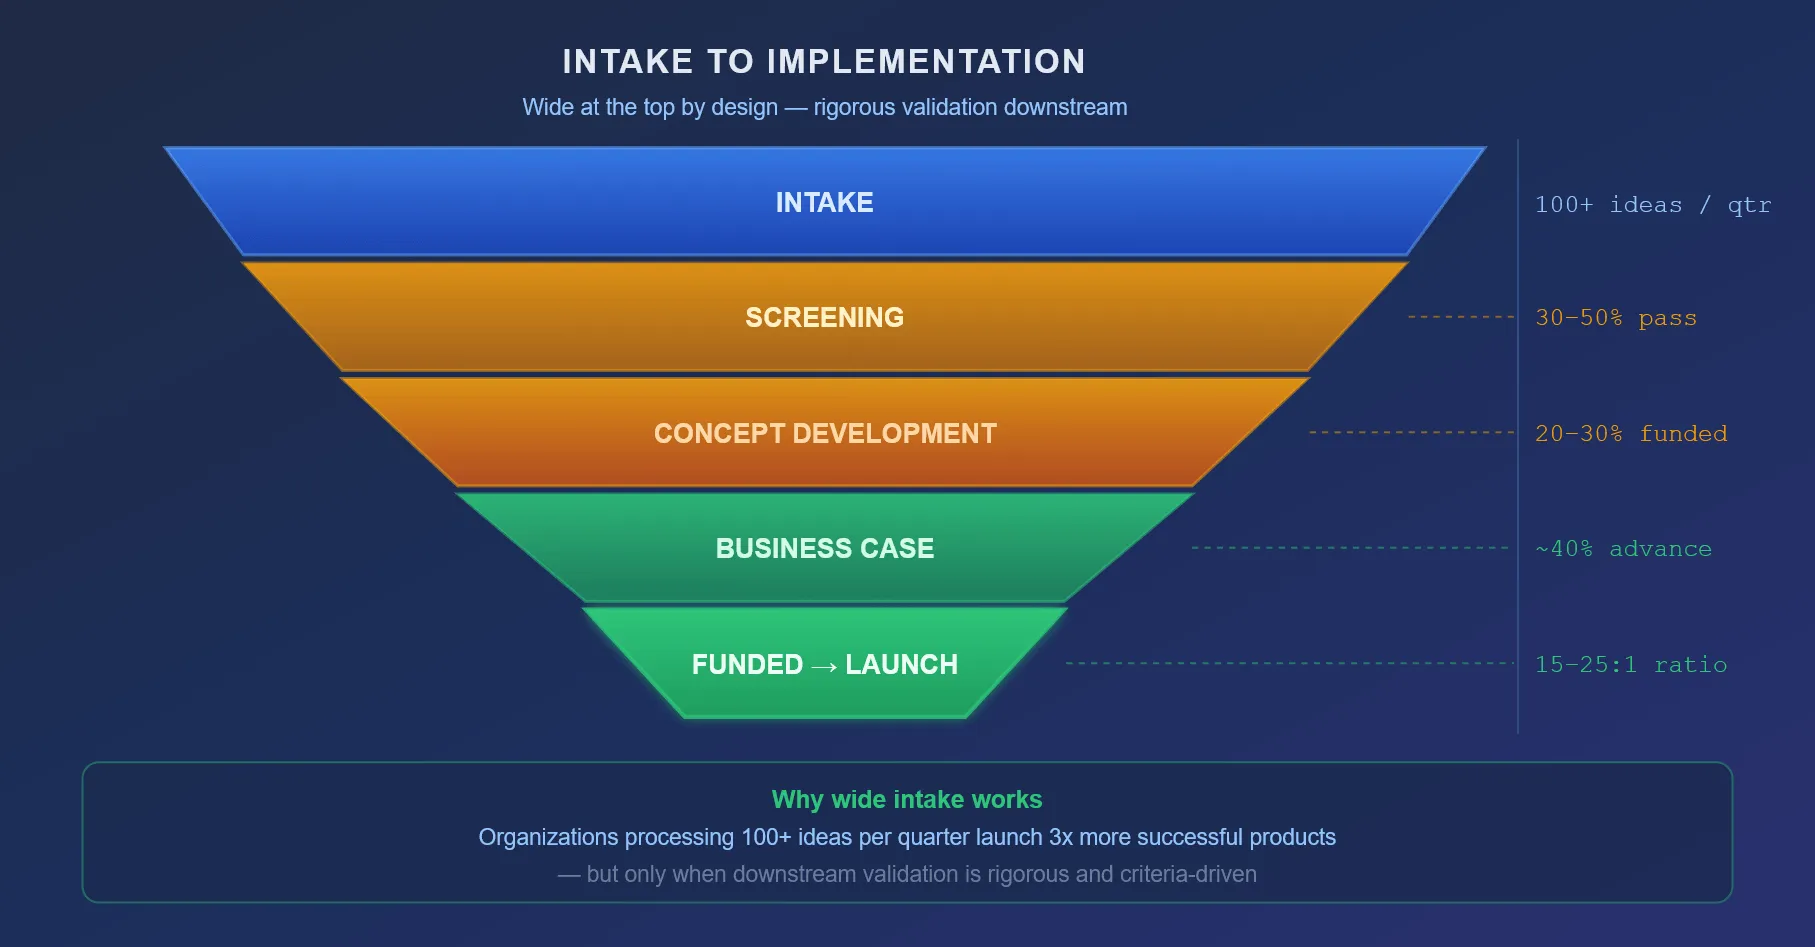
But volume at the top doesn’t mean chaos downstream. Intake-to-screening progression sits at 30-50%. Of those, only 20-30% reach full development funding.
The funnel narrows aggressively, but it narrows based on predefined criteria applied consistently, not on reviewer bandwidth or political leverage.
Organizations processing 100+ ideas per quarter and applying rigorous downstream validation end up launching three times more successful products than peers.
This structure solves the volume paradox. You need a lot of raw material to find exceptional ideas, but you can’t let mediocre ideas consume resources.
Ownership That Sticks
Every idea that enters a high-performing funnel has an owner. Every stage has an owner. Every gate has a decision authority who actually holds that authority.
When multiple departments touch an idea and no one is held accountable for moving it forward, it stalls. The responsibility diffuses. Review comments pile up.
The idea vanishes not because it was bad, but because no one’s job performance depended on deciding its fate.
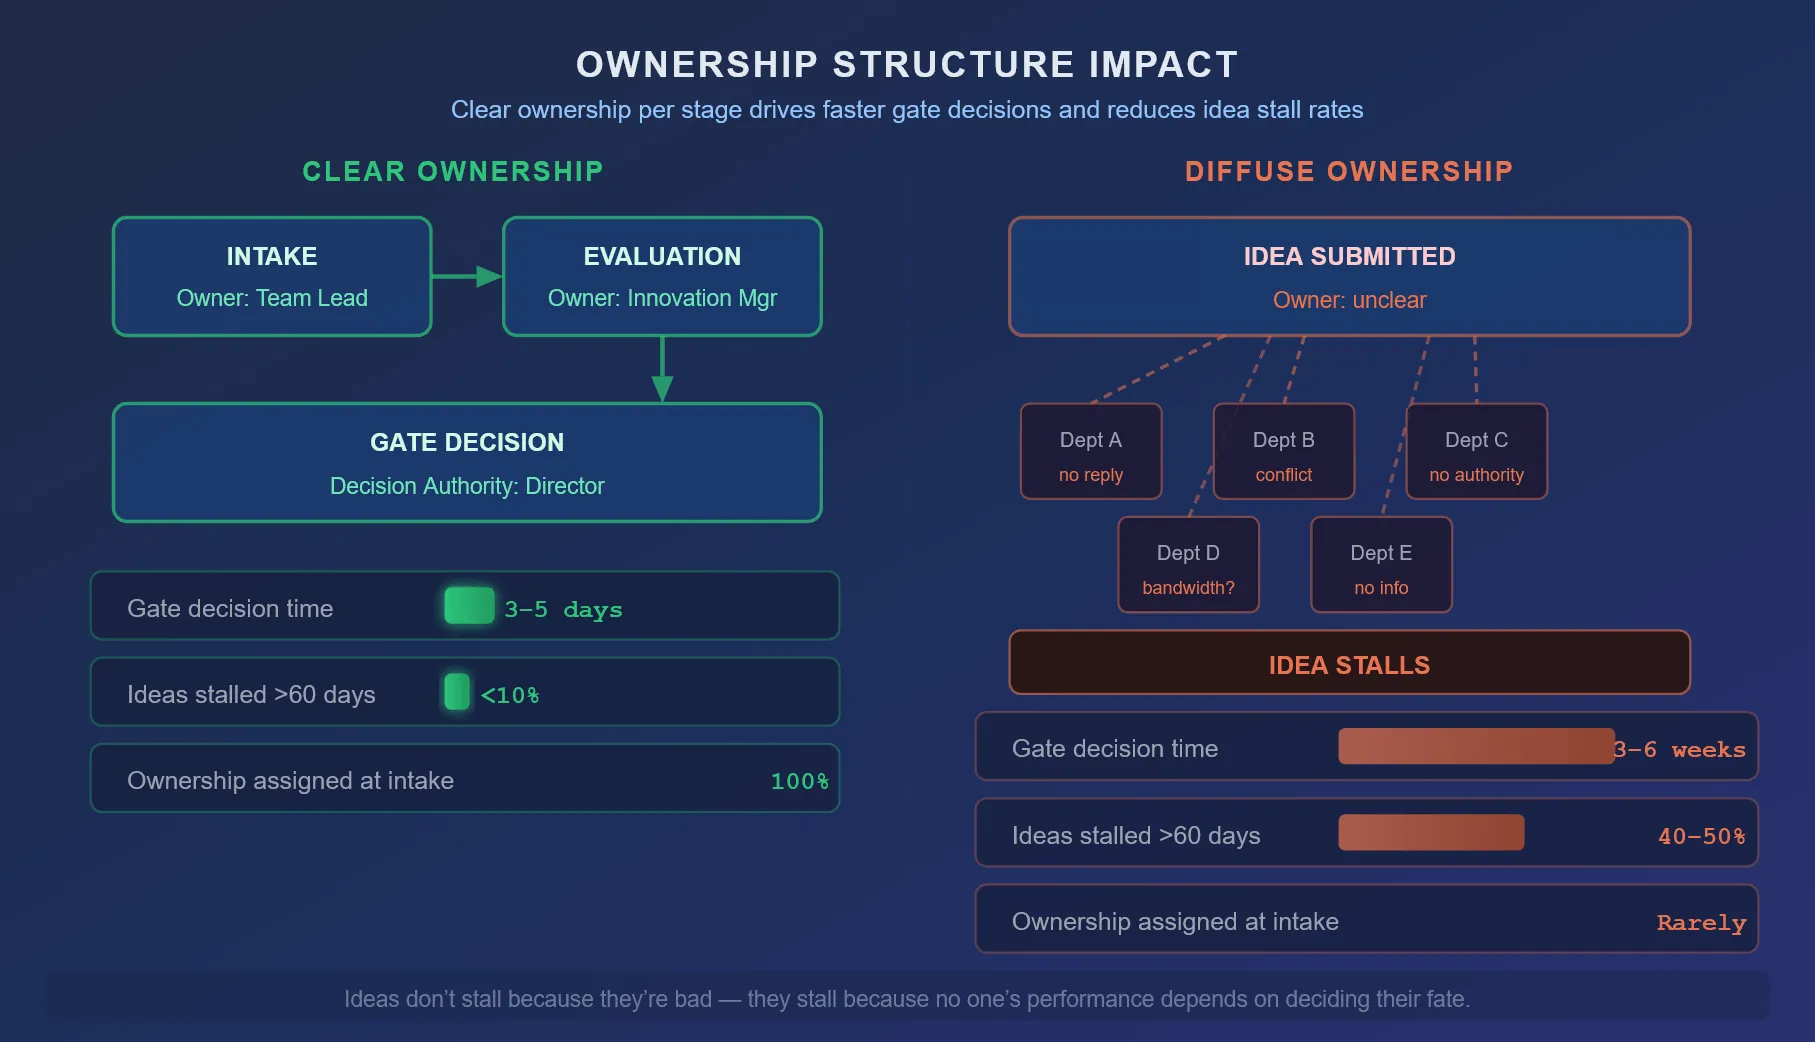
Accountability also speeds cycles. Clear ownership means clear decision authority. And clear decision authority means gate reviews land in days, not weeks.
What Broken Funnels Look Like (The Anti-Patterns)
Broken funnels fail in predictable ways. The patterns below describe the most common failure modes and why they persist.
These anti-patterns are worth learning because they’re avoidable. Once you see them, fixing them becomes straightforward.
The Bottleneck at Evaluation
The most visible failure mode: ideas pile up at the evaluation stage. No SLA on gate decisions and no rule saying a review must be completed in X days.
What happens next is predictable:
- Review timelines stretch from weeks to months
- Ideas age in the queue
- Submitters move on; context is lost
- Reviewers evaluate stale ideas, not fresh ones
- Gate quality decays
- New ideas stop flowing (submitters learn they’ll disappear)
- The funnel becomes a gesture, not a process
95% of idea failures trace back to lack of process, not lack of merit. A bottlenecked funnel is essentially a machine for killing innovations.
Popularity Over Fit
Some organizations use voting to filter ideas. The ones with the most upvotes advance. However, this is almost always a mistake as popular ideas are rarely the best ideas.
Popularity tracks preference in the room, not strategic fit or technical feasibility.
- An idea that appeals to 70% of your workforce might cannibalize your current product line.
- An idea that only three people understand might be the breakthrough.
High-performing funnels don’t ask: “Do you like this idea?” They ask: “Does this idea meet our strategic criteria?” The second question produces different results.
Stages Without Exit Criteria
An idea advances because no one killed it. Without explicit exit criteria, stage definitions become fuzzy.
Is an idea in “Concept Development” because it has a viable business model? Or just because someone is still thinking about it?
No one knows. Ideas drift forward through inertia, consuming review cycles that should go to promising submissions.
These are zombie ideas: not alive enough to warrant real investment, but not dead enough to stop moving. They’re incredibly common in funnel dysfunction and a resource trap.
Metrics That Track Activity, Not Quality
Submission count, reviews completed, gate participation rate. These are activity metrics and they measure motion, not innovation.
High-performing funnels track quality signals:
- Survival rate per stage
- Average time-in-stage
- Gate decision speed
- Percentage of ideas advancing to the next phase
- Percentage of implemented ideas that were originally accepted through the funnel
That last metric closes the loop. It tells you whether your gate decisions actually predicted success. Activity metrics feel good to report. Quality metrics reveal whether the funnel actually works.
Fragmented Visibility
Ideas live in email, spreadsheets, and the minds of individual reviewers. No single source of truth for idea status, stage progression, decision rationale, or ownership.
When visibility fragments:
- You can’t see bottlenecks without a unified view of where ideas sit
- You can’t identify patterns when data is scattered
- You can’t make portfolio-level decisions without portfolio visibility
Coordination breaks down, and execution stalls.
High-Performing vs. Broken: Two Funnels Side by Side
The same 150 ideas enter both funnels. What comes out and why tells you everything about the structure behind them.
Funnel A: Structured Approach
Monthly intake: 150 ideas, with strategic alignment criteria set before evaluation.
Cross-functional review team with defined decision authority and a five-business-day gate SLA. Stage definitions are explicit, ownership assigned at intake, and weekly funnel health tracked via dashboard.
Progression:
- 35% pass screening → 53 ideas
- 65% of those move to concept development → 34 ideas
- 50% advance to business case → 17 ideas
- 40% get funding → 7 ideas
Of those seven, five implement successfully.
Resource intensity: eight hours of preparation per gate cycle and twelve hours of review time across five reviewers. Resource waste: minimal.
Outcome: 5-7 innovations launched annually with an average development cycle of 6 months from concept to launch. New product revenue contribution: 28%.
Funnel B: Unstructured Approach
Monthly intake: 200+ ideas with no predefined criteria.
Whoever has bandwidth reviews next, with no formal decision authority. Gate review timelines are “when ready,” stage definitions loose, ownership unclear, and no funnel visibility.
Progression:
- 15% survive screening → 30 ideas
- 20% of those move forward → 6 ideas
- An indeterminate number reach business case
- Maybe two get funded
- One launches if everything falls into place
Resource intensity: 40+ hours of email and meeting prep per gate cycle, with review time scattered across 10+ people with conflicting priorities. Resource waste: extensive.
Outcome: 1-2 innovations launched annually with an average development cycle of 14+ months (compounded by delays and restarts). New product revenue contribution: 7%.
The gap between these funnels comes down to structure, not funding or team talent. Funnel A’s results come from data-driven scoring and collective decision-making, not more resources.
| Dimension | Structured | Unstructured |
|---|---|---|
| Intake per month | 150 | 200+ |
| Ideas reaching concept stage | 53 (35%) | 30 (15%) |
| Prep time per cycle | 8 hours | 40+ hours |
| Gate decision SLA | 5 days | 6+ weeks |
| Innovations launched annually | 5-7 | 1-2 |
| Average time to launch | 6 months | 14+ months |
| Resource waste | Minimal | Extensive |
| New product revenue % | 28% | 7% |
Where AI Changes the Calculation
AI adoption in innovation management is accelerating, and the conversation has shifted from “Should we use AI?” to “What should we use it for?”
In high-performing funnels, AI does a few specific things well:
- It reduces evaluation preparation time from 40+ hours per cycle to 4-6 hours.
- It flags ideas that have been stalled for 60+ days.
- It surfaces scoring patterns: which reviewers cluster around similar ideas, which criteria drive the biggest advancement gaps, which evaluation teams show the most consistency.
- It pulls all of this data into one place so you can see your funnel clearly.
The gate decision stays human. Humans retain authority over go/kill/hold.
AI amplifies decision quality by giving people the data they need to decide faster and more confidently, without removing the judgment call.
This compresses cycles without sacrificing rigor. The gate still exists, criteria stay predefined, and decision authority stays human. The preparation work shrinks, and decisions land faster.
Start With Visibility, Then Build the Rest
Start with one question: Can you see your funnel clearly right now?
Can you pull a current snapshot showing how many ideas sit in each stage, who owns them, and how long they’ve been there?
If the answer is no, that’s your first fix. Visibility makes bottlenecks and zombie ideas obvious. Once they’re obvious, you can act on them.
Take these three steps now:
- Map your current funnel: stage names, owners, and SLAs for each gate.
- Identify where ideas stall: check average time-in-stage for the past 90 days.
- Set one gate SLA and enforce it for 30 days before adding new criteria or owners.
Ready to stop losing ideas to approval queues that no one monitors?
Download our Idea Management ebook on innovation governance, or book a demo to see how Accept Mission handles automated routing, escalation workflows, and audit trails.








 English
 Dutch
Dutch Portuguese
 Spanish
 French
 German
 Arabic