
What Does Your Innovation System Actually Look Like? (Case for Taking the Maturity Scan)8 min read

Most organizations treat innovation as a forward-looking discipline.
They obsess over what’s next: the pipeline, the roadmap, the next breakthrough. Almost none ask a more uncomfortable question: does the system running all this activity actually work?
83% of senior executives rank innovation among their top three priorities, yet just 3% qualify as innovation-ready. What many lack is an honest read on whether their system can actually deliver on it.
That’s where the innovation maturity scan comes in.
It’s a free, 8-10 minute assessment that gives you a structured baseline of where your system stands, and a recurring feedback loop to close the gap between what you’re doing and whether it’s working.
The Gap Between Innovation Activity and Innovation Capability
Activity and capability aren’t the same thing. You can run a lot of initiatives, launch multiple portfolios, and still have a system that barely functions.
BCG’s longitudinal tracking shows this clearly. Innovation readiness among companies fell from 20% in 2022 to 9% in 2023 to 3% in 2024. Meanwhile, innovation activity stayed steady.
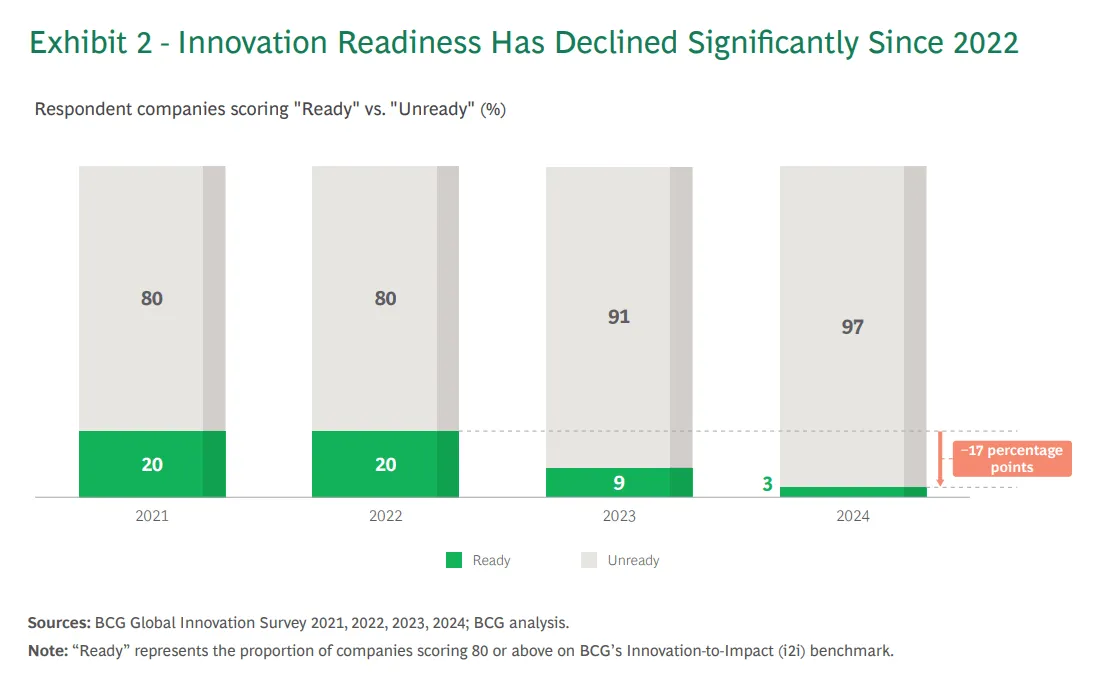
Organizations were doing more while their underlying capability eroded.
They became what researchers call “zombie innovation organizations” (going through the motions, executing activities, but lacking the structure to turn effort into results).
The consequences are measurable:
- Nearly half of executives report that fewer than a quarter of their projects reach market on time
- About one-third report similar rates of launches missing budget
- Up to a third have no visibility into whether offerings launched on schedule or within budget
The first step toward a better system is an honest picture of where it actually stands. That means measuring the system, not just the activity inside it.
What the Innovation Maturity Scan Actually Measures
The maturity scan is deliberately streamlined. Twenty-six questions. No login required. Results in under ten minutes. Progress autosaves, so you can walk away and come back if needed.
It covers six dimensions that matter:
- Strategy and ambition
- Governance and leadership
- Culture and people
- Process and portfolio
- Tools and data
- Ecosystem and partnerships
These aren’t aspirational categories. They’re the operational dimensions where innovation capability actually lives.
Six Categories, Each Probed Twice
The scan’s core design feature is a dual-question logic.
Every sub-dimension gets two questions:
- Whether you have a structured approach in place (structure scale)
- How consistently it’s applied in practice (evidence of coverage)
This surfaces something most assessments miss: the gap between intent and reality.
A company might have innovation strategy on paper. But do leaders actually apply it when making decisions?
A team might have a portfolio review process. But does it govern resource allocation consistently, or does it run in parallel to the real decision-making?
Take Innovationlands, a mid-sized consumer goods company that took the scan.
They had genuine innovation activity. Multiple portfolios. Engaged leadership. Dedicated teams working on new product development. On the surface, a healthy innovation organization.
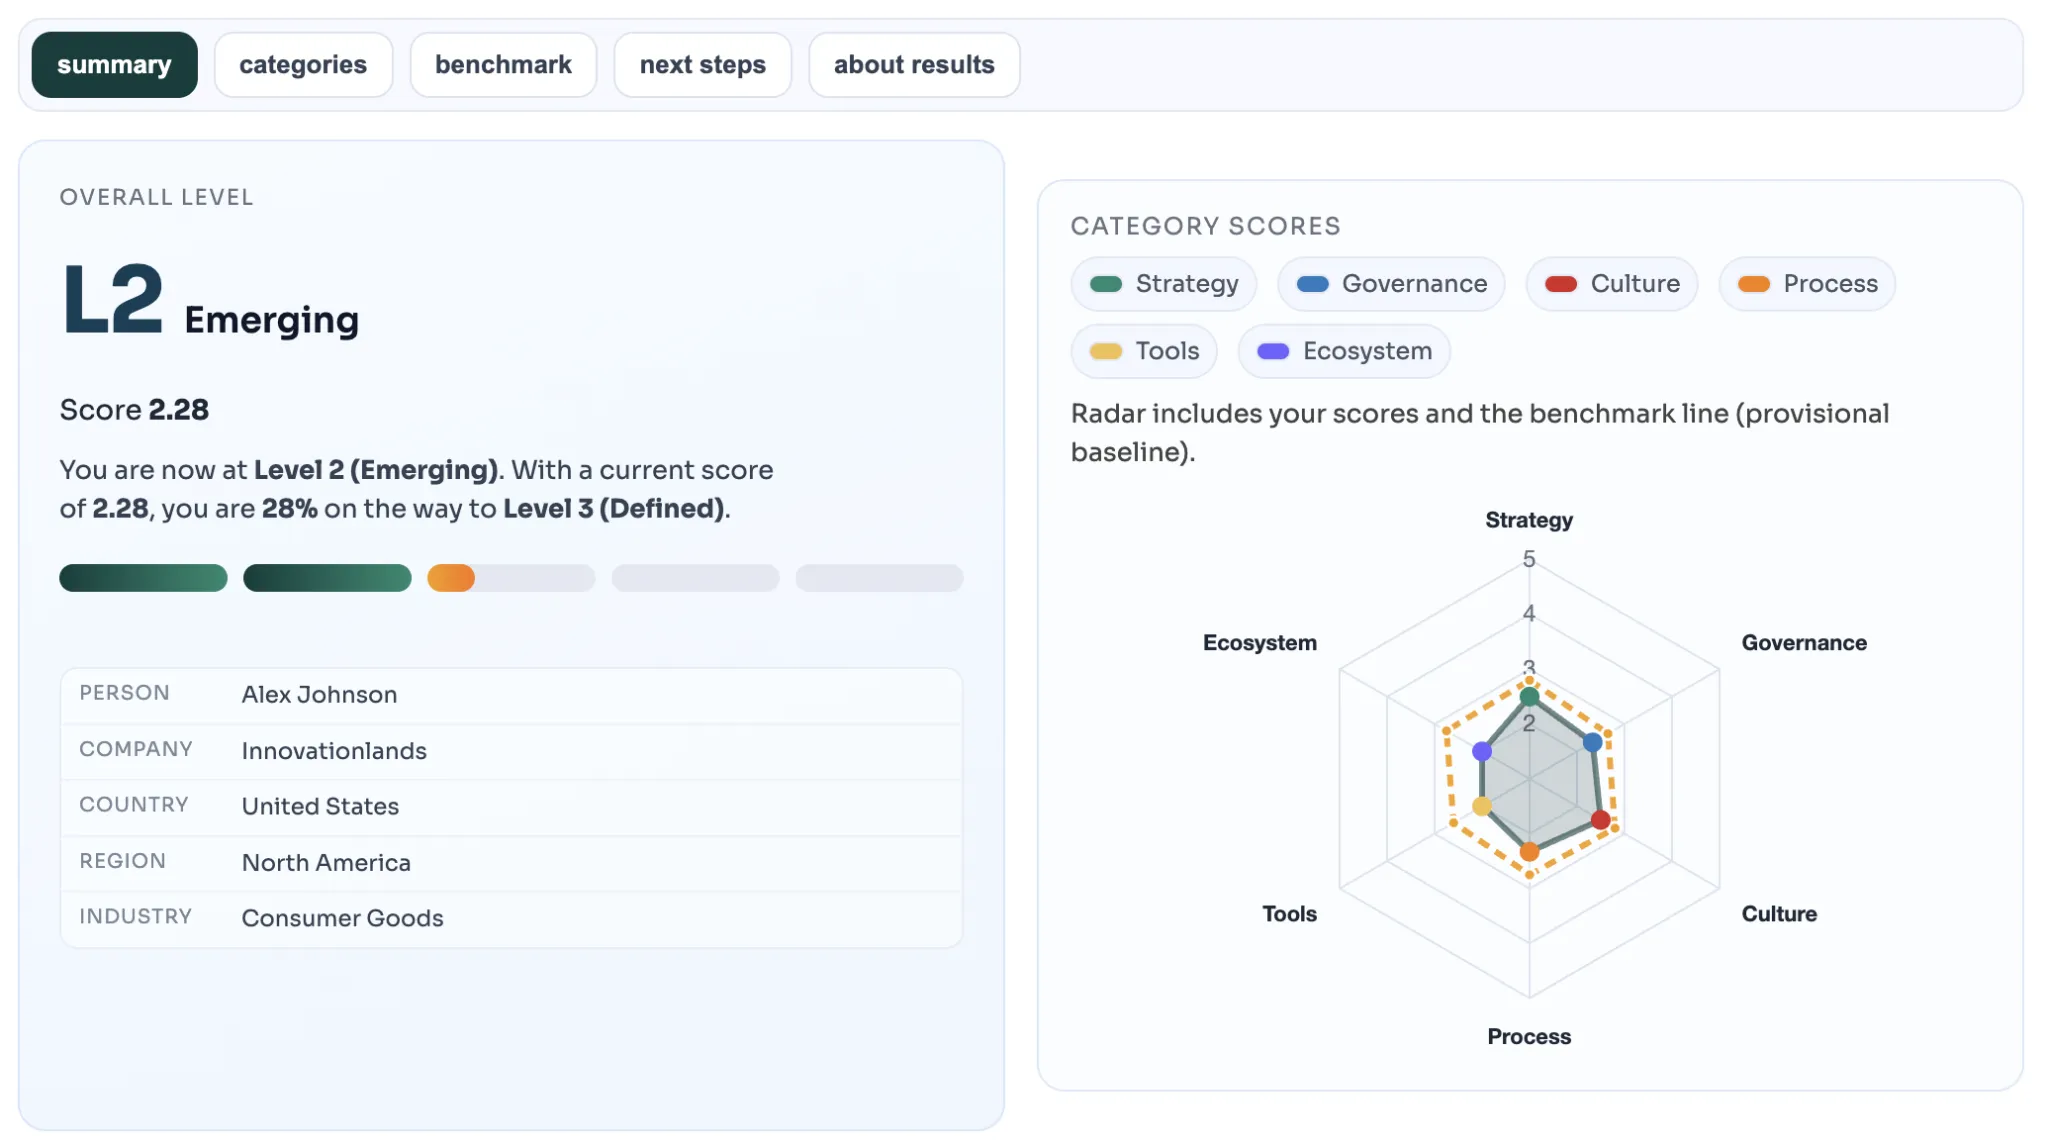
Their overall score: Level 2 Emerging. 2.28 out of 5.00.
That score reveals what the dual-question logic uncovers:
Innovationlands had strategic intent in parts of the organization. But inconsistent execution across the system. They weren’t broken. They were unfocused.
Priority Rankings, Not Just Scores
The scan doesn’t just measure. It prioritizes. The categories tab ranks all six dimensions by improvement impact potential.
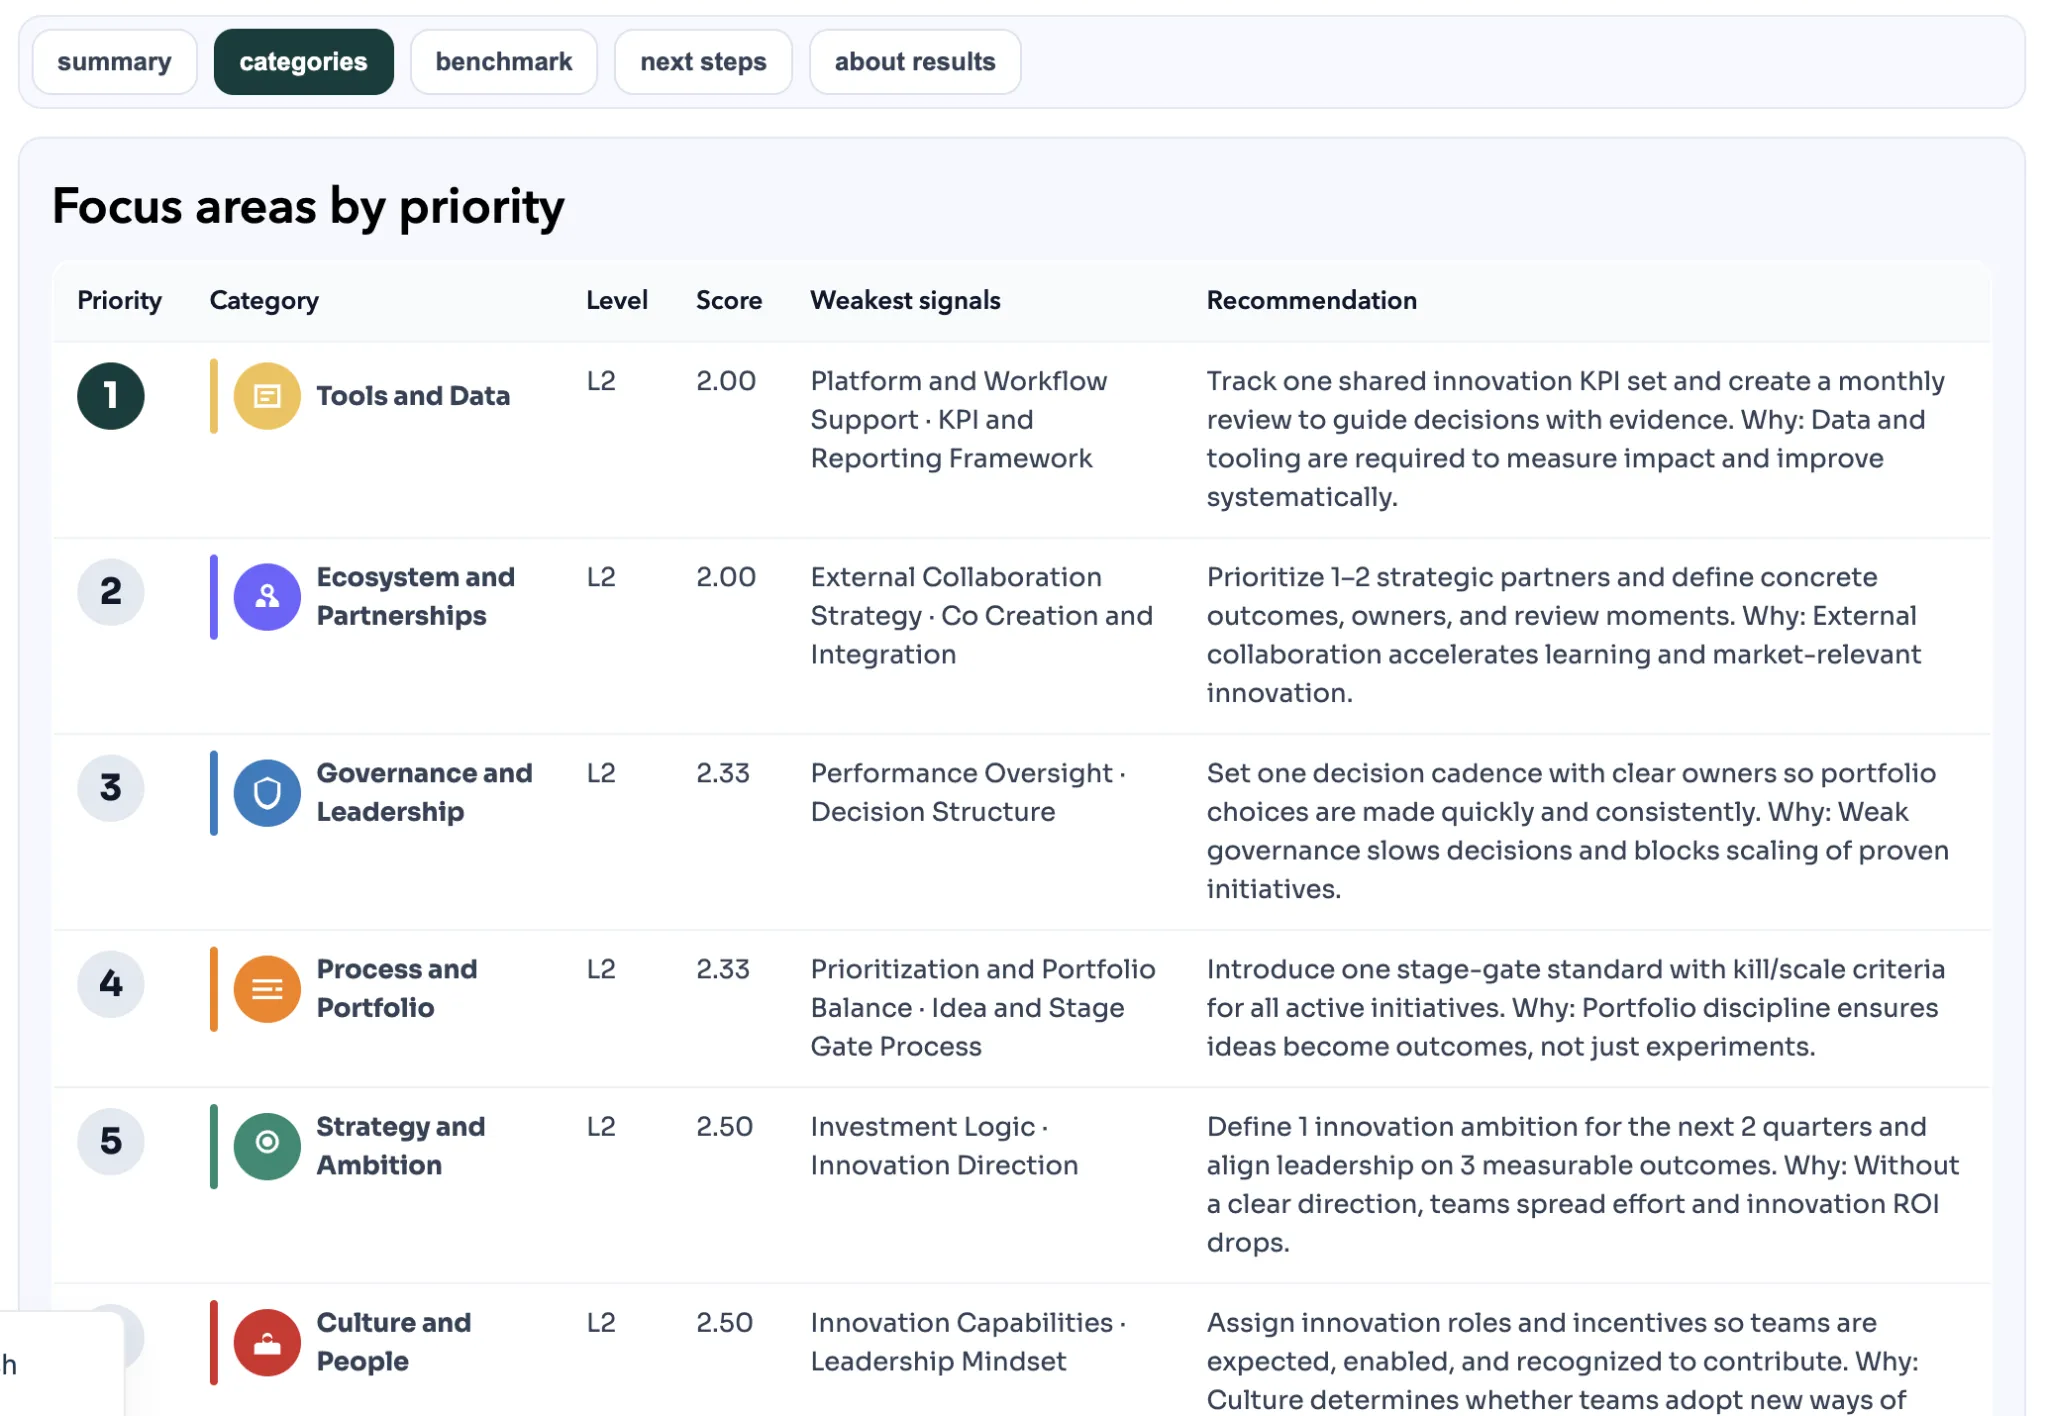
Where should you start? Not necessarily where you’re weakest in absolute terms, but where an investment will move the needle fastest.
For Innovationlands, the priority ranking looked like this:
| Priority | Category | Score |
|---|---|---|
| 1 (Start here) | Tools and Data | 2.00 |
| 2 | Ecosystem and Partnerships | 2.00 |
| 3 | Governance and Leadership | 2.33 |
| 4 | Process and Portfolio | 2.33 |
| 5 | Strategy and Ambition | 2.50 |
| 6 | Culture and People | 2.50 |
Every category also includes a specific, actionable recommendation with a rationale.
For tools and data (their #1 priority), the scan recommended: “Track one shared innovation KPI set and create a monthly review to guide decisions with evidence.”
That’s not abstract. That’s the next step you can take on Monday.
Why Your Industry Benchmark Matters More Than Your Raw Score
A maturity score in isolation is incomplete. A 2.28 doesn’t tell you whether you’re close to your industry norm or falling behind your peers.
Industry prioritization varies widely by sector, from 98% of tech hardware companies ranking innovation in their top three down to 67% in wholesale and retail. The innovation bar shifts depending on context.
The scan’s benchmark feature puts your scores against industry peers. You see a hexagonal radar chart with your six category scores overlaid against a dashed orange line showing the industry baseline.
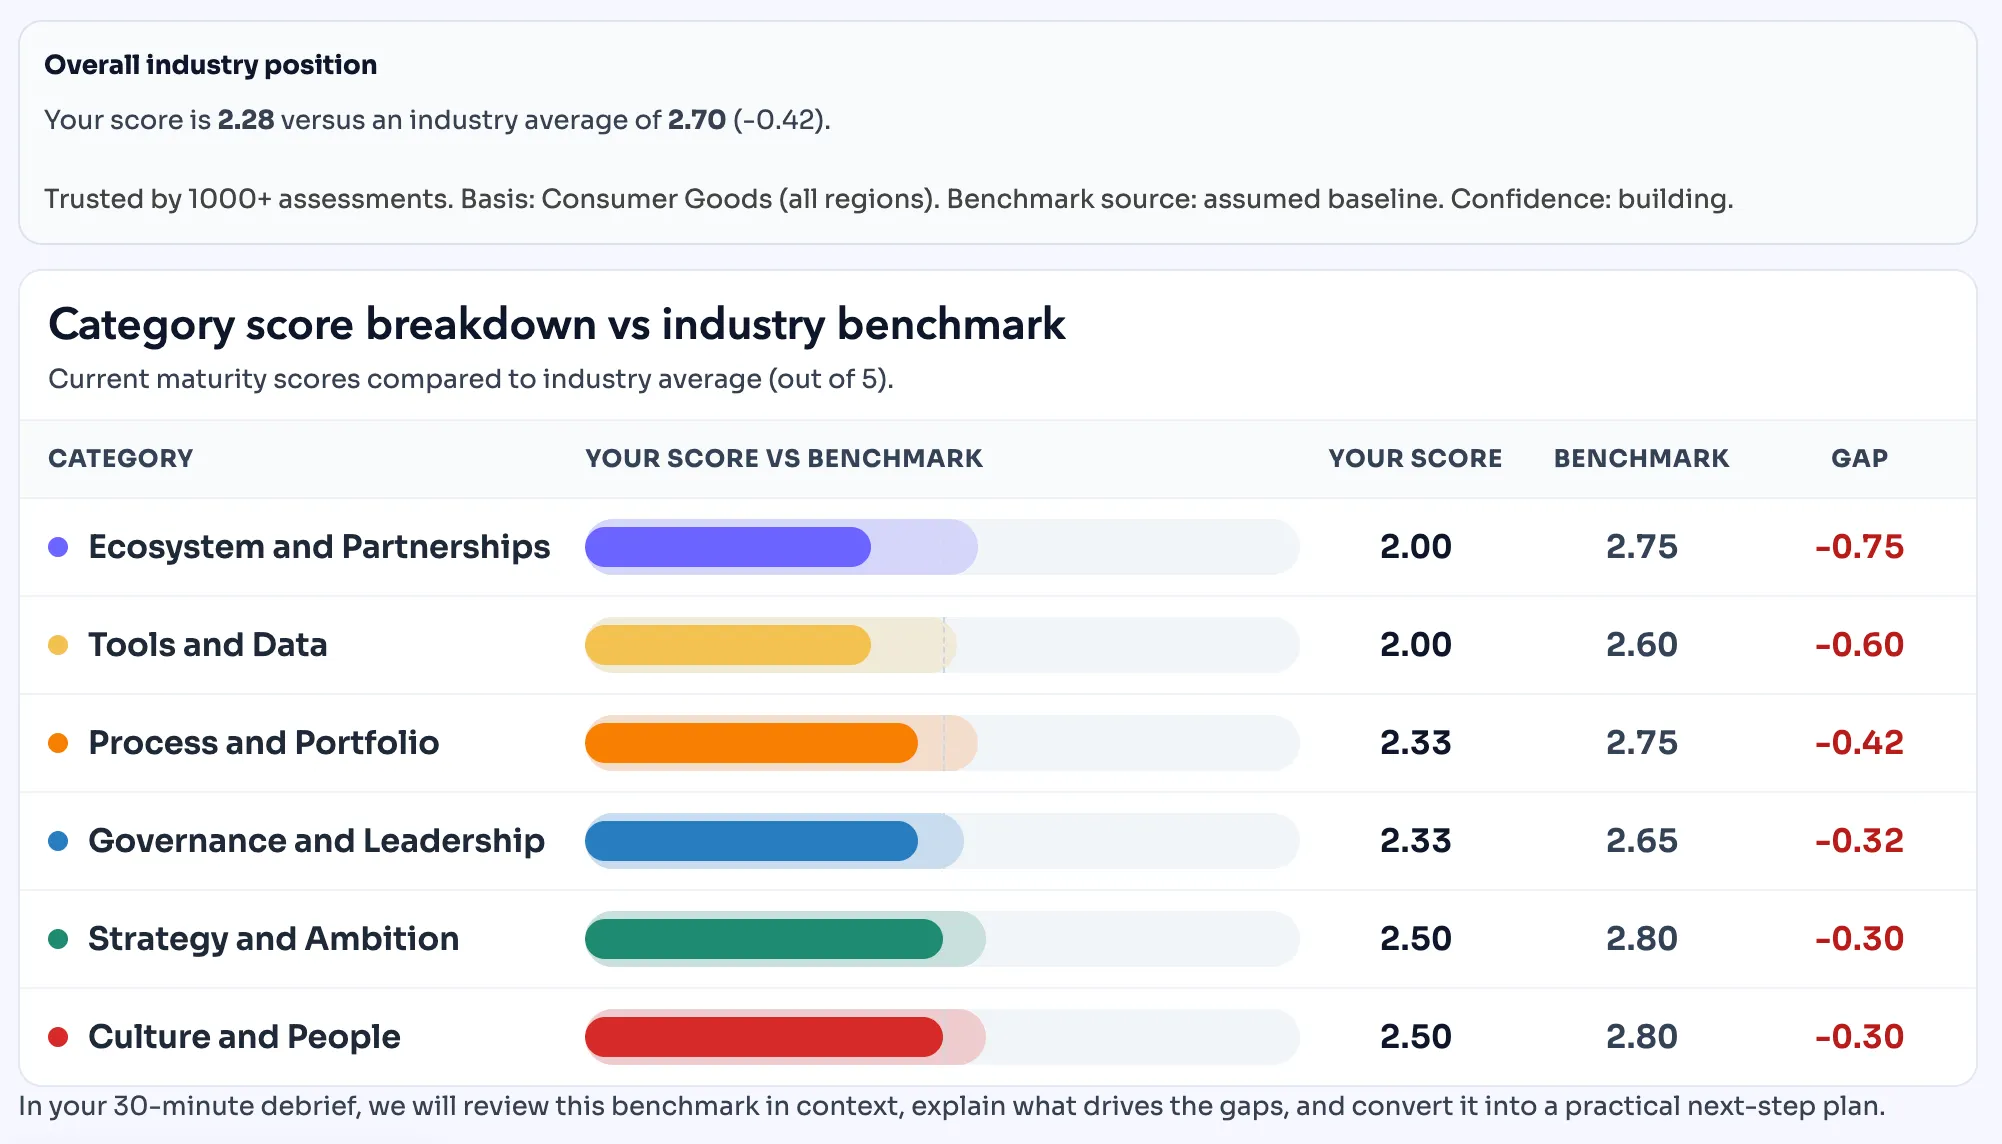
For Innovationlands, benchmarked against consumer goods peers, the picture shifted:
| Category | Innovationlands Score | Industry Benchmark | Gap |
|---|---|---|---|
| Ecosystem and Partnerships | 2.00 | 2.75 | -0.75 |
| Tools and Data | 2.00 | 2.60 | -0.60 |
| Process and Portfolio | 2.33 | 2.75 | -0.42 |
| Governance and Leadership | 2.33 | 2.65 | -0.32 |
| Strategy and Ambition | 2.50 | 2.80 | -0.30 |
| Culture and People | 2.50 | 2.80 | -0.30 |
| Overall | 2.28 | 2.70 | -0.42 |
Here’s what emerged: Innovationlands’ leadership was confident they had a strategy and culture problem. Those were the categories where they expected to lag.
The data said otherwise. Their biggest gaps weren’t strategy or culture but were tools and data, and ecosystem and partnerships. The infrastructure and external collaboration dimensions where they’d underinvested.
That’s the power of benchmarking. It replaces intuition with evidence.
The scan is also transparent about confidence levels. Benchmark data is labeled as “Insufficient until at least 5 comparable scans.” You’re never misled about the reliability of peer comparison data.
And the stakes of that comparison are real. According to BCG, strategy-aligned organizations report new product sales 5 percentage points above the median.
And strategy-led innovators achieve share of revenue from new products 74% higher than companies with weak strategy-innovation linkage.
Understanding your gaps relative to your industry isn’t an exercise in competitive vanity. It’s about resource allocation and revenue.
Rescanning Is Where the Real Value Lives
A one-time assessment is useful. It gives you a baseline. But a second scan is where the system becomes a management tool.
BCG’s longitudinal tracking tells that story. Innovation readiness fell from 20% in 2022 to 9% in 2023 to 3% in 2024.
Those numbers look catastrophic on the surface. But what they actually reveal is that measurement works. Organizations saw the drift and had the chance to correct course.
Without repeat assessment, drift goes invisible. You get busier, launch more initiatives, and your underlying capability erodes without you realizing it.
The scan is built for recurrence. After you get your results, you can schedule a rescan (2, 3, 4, or 6 months out) and Accept Mission sends a reminder.
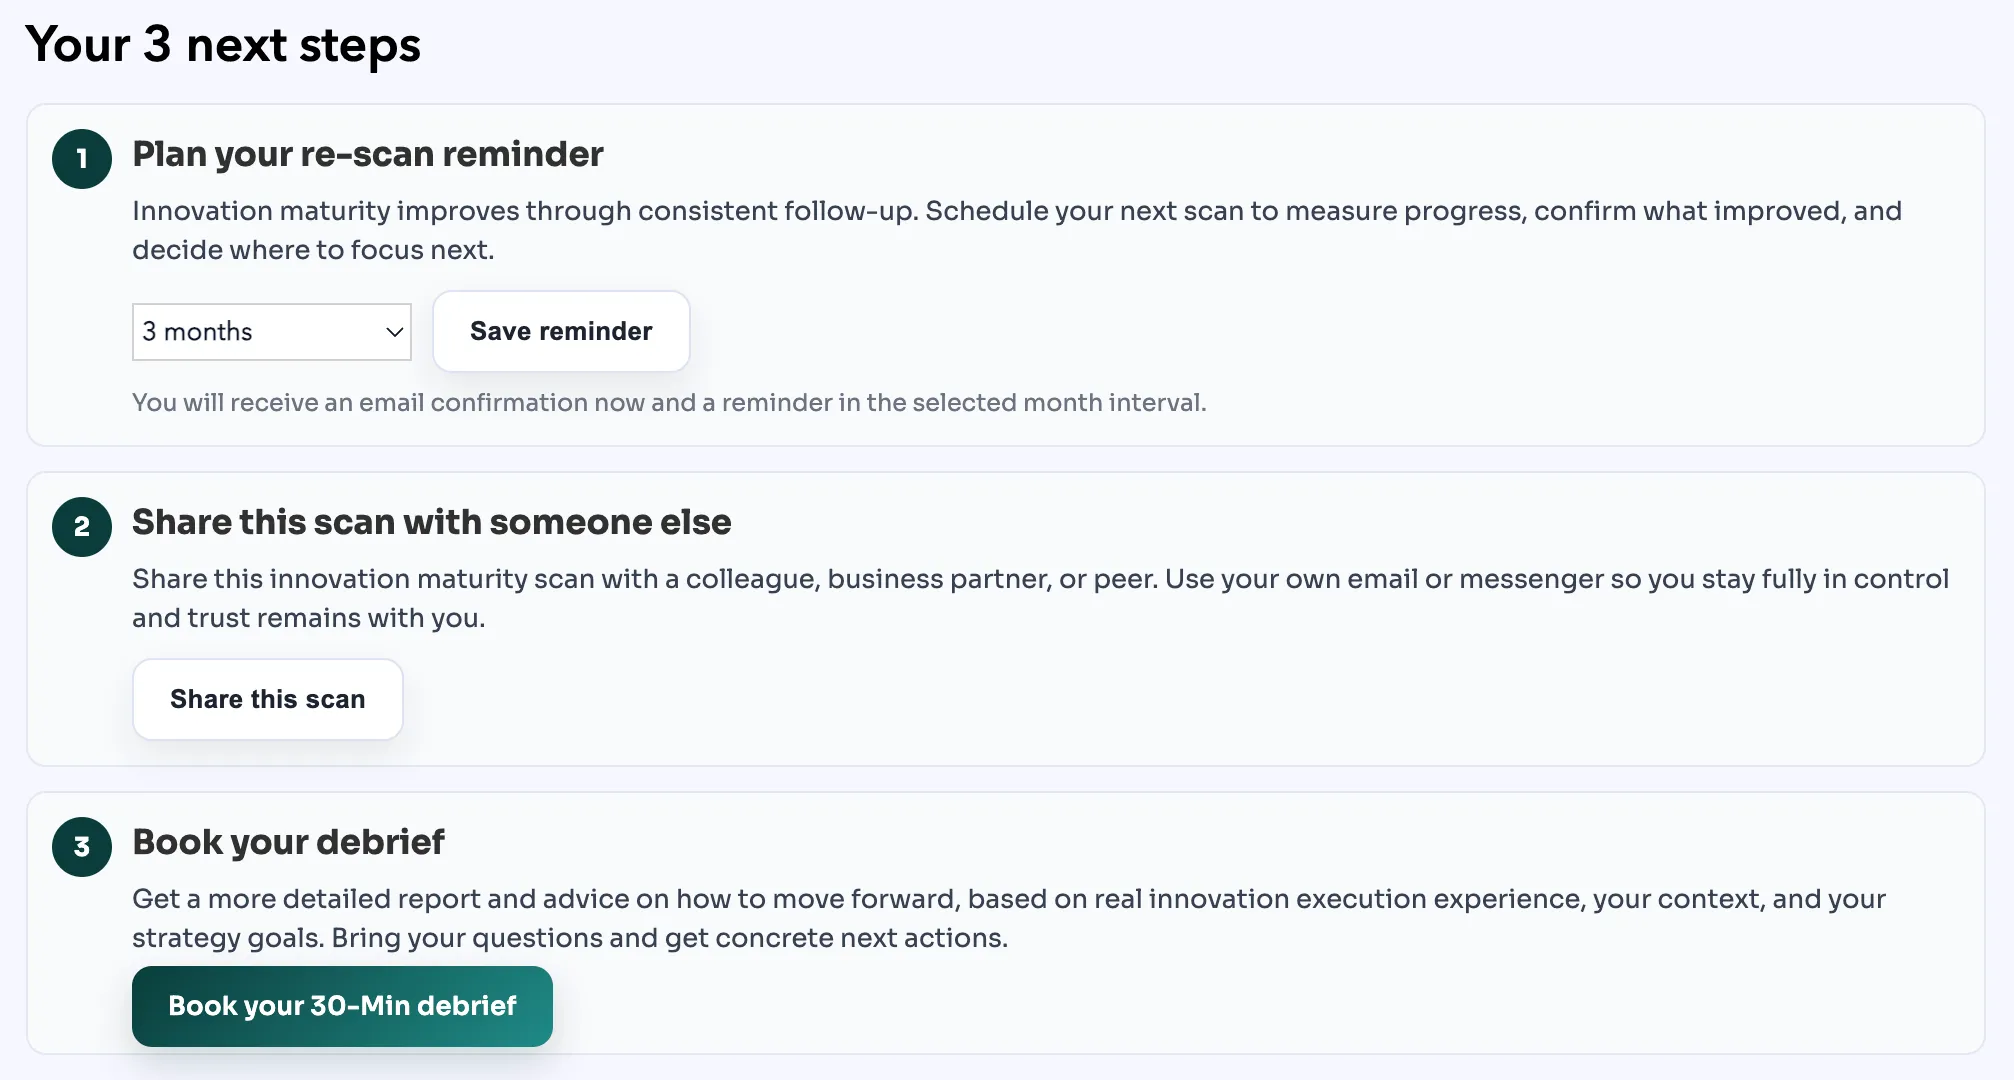
When you rescan, the previous scans tab shows score movement by category and side-by-side comparisons between assessments.
The feedback loop is straightforward:
Identify a priority, invest in it, rescan to validate whether the investment moved the number. If it did, move to the next priority. If it didn’t, adjust before spending more time and resources.
Start With a Structured Baseline
Innovationlands landed at 2.28/5.00, but left with a prioritized list of categories, a specific next step, and a clear decision about where to focus first. That’s better than most innovation organizations have.
The stakes are real.
Accept Mission’s data shows that data-driven scoring and structured decision-making help organizations achieve approximately 30% reduction in resource waste.
When you’re managing innovation portfolios, that compounds quickly.
The scan is free, takes about 10 minutes, and the updated version now includes rescan scheduling, side-by-side comparisons, and industry benchmarking.
It’s not just a diagnostic. It’s a management tool designed to evolve with your system.
Ready to see where your innovation system actually stands? Take the innovation maturity scan. It’s free, ~10 minutes, and results are immediate. No login required.
Request a demo to see how Accept Mission gives you transparency and rigor across the same six dimensions your scan measures — from ideation through launch.



 English
 Dutch
Dutch Portuguese
 Spanish
 French
 German
 Arabic