
Reporting Without Rebuilding Slides: One-Source Portfolio Updates9 min read

Most organizations follow a predictable reporting cycle.
The pattern is consistent:
- Export data from three systems and check it against last month’s numbers
- Rebuild charts because someone changed a formatting preference
- Send the deck to leadership
- Watch it go stale within two weeks
- Start over
Leadership decides on three-week-old data, teams maintain parallel spreadsheets because they don’t trust the numbers, and the portfolio manager spends 40% of their time on reconciliation instead of strategy.
A structural shift is what fixes this: one system holds the live portfolio data, and all reporting outputs pull from that source automatically.
Why the Slides Aren’t the Problem
The visible symptom is recurring: reports rebuilt every cycle, data pulled from spreadsheets and email threads, identical charts reformatted repeatedly.
The root cause is structural.
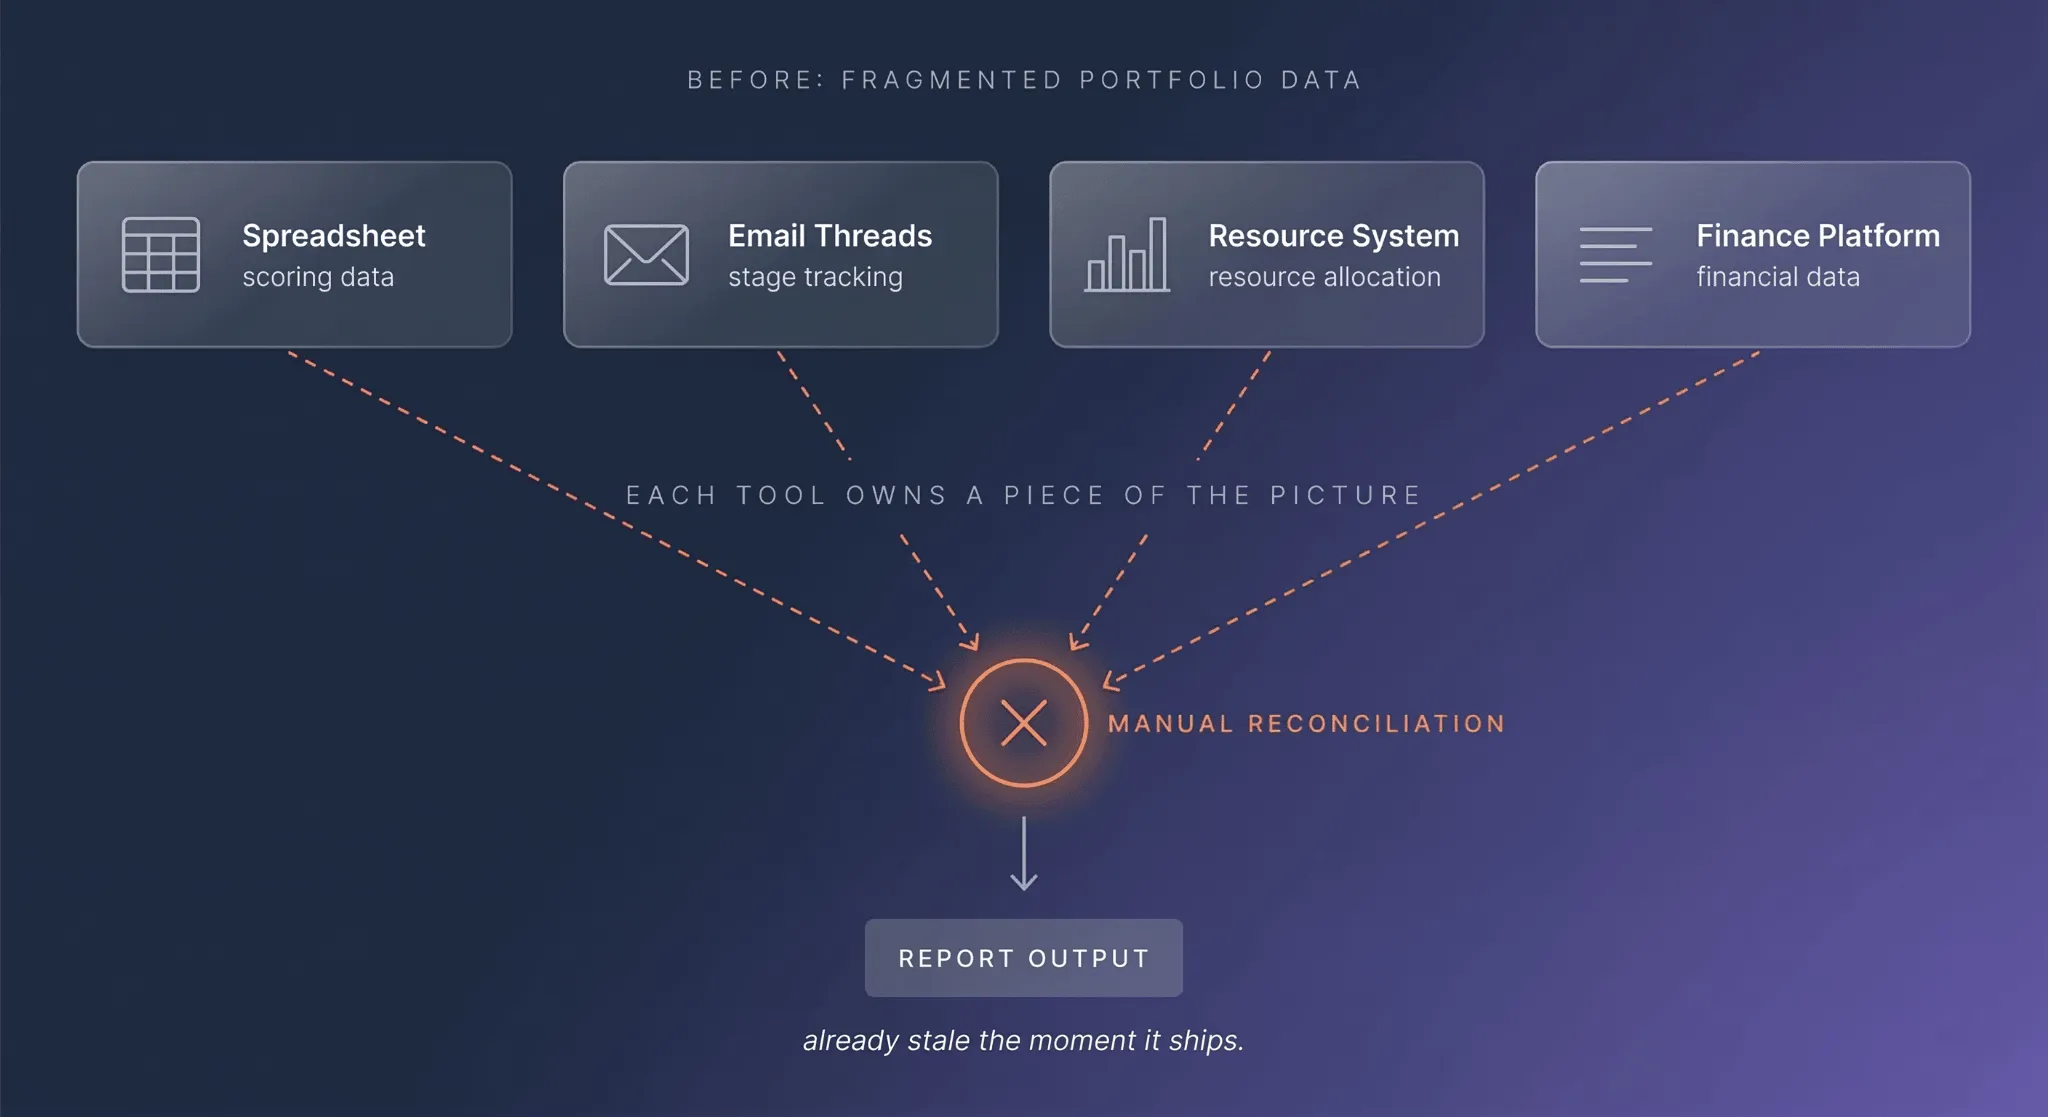
Your portfolio data is fragmented across multiple tools:
- Scoring data in a spreadsheet
- Stage tracking in email
- Resource allocation in a separate system
- Financial data in another platform
Each tool owns a piece of the picture. When you need to report, you’re reconciling: pulling from multiple sources, checking the numbers align, and hoping nothing changed before leadership sees it.
This creates the “dueling dashboards” problem: three reports going to the same leadership team, each showing slightly different numbers.
Not because anyone is lying, but because the data sources don’t agree on which version is canonical.
Research shows 68% of enterprises cite data silos as their number one barrier to extracting value from information assets…and when portfolio data lives in disconnected places, every report becomes a reconciliation exercise.
The data architecture is where the problem lives.
What Manual Reporting Actually Costs
The time cost is visible: research shows 83% of professionals create or deliver presentations at least a few times per month, with 44% doing so weekly or more.
Innovation managers report at higher frequency: bi-weekly cycles, ad hoc stakeholder requests, decks that remain in continuous revision.
A more significant cost exists beneath the time investment.
The cost of stale data:
Leadership decisions get made on data that’s already outdated when it lands.
You pull numbers on Tuesday, format them Wednesday, the deck goes out Thursday. But by Friday, projects have stalled and resource allocation has shifted. The decision still gets made on Tuesday’s picture.
The reinforcing cycle:
Stale data produces stale decisions, which generate additional reporting cycles, rebuilds, and reconciliation efforts. Portfolio legibility decreases as reporting frequency increases.
What “One Source” Actually Means
In practice, a single source of truth is a structural arrangement.
It means one system holds the live data: which projects are in which stage, what their scores are, what resources they’re consuming, what decisions are pending, who owns them.
Everything else, every report, every dashboard, every stakeholder view, pulls from that single system.
No parallel spreadsheets, no side tools where the real data lives. One place where the portfolio is recorded, and every view flows from there.
A true single source of truth has four critical attributes:
- Up-to-date information that reflects current reality
- Complete data with no hidden information or exceptions
- Traceable audit trails showing who changed what and when
- Accessible, user-friendly interfaces so people actually use it
The key shift is conceptual: report-as-document versus report-as-view.
A report-as-document is what you’re building now: you fill it with data, send it, and it immediately becomes a snapshot.
The moment it leaves your hands, it begins aging. Ask a follow-up question next week and you have to rebuild it from scratch.
A report-as-view is generated from live data.
An executive logs in and sees the current portfolio health, a PMO dashboard shows real-time bottlenecks, and a project team sees their stage readiness.
All of it updates continuously because all of it reads from the same source.
Here’s what lives in each layer:
| In the Source | In the Output |
|---|---|
| Project stages and progression | Executive summary narratives |
| Scoring outcomes and criteria | PMO health dashboard |
| Resource allocation | Stakeholder-specific views |
| KPIs and metrics | Board-ready visualizations |
| Decision records | Team-level progress reports |
| Ownership and accountability | Meeting agendas and talking points |
The rule is simple: don’t put data in the output that doesn’t exist in the source.
What breaks this rule? Teams maintaining parallel spreadsheets “just in case,” a PMO with its own scoring version, or a finance team running a separate KPI calculation because the systems don’t align.
Once that happens, you’re no longer managing one portfolio. You’re managing multiple versions of the truth, each competing for authority.
The Three-Audience Model for Portfolio Reporting
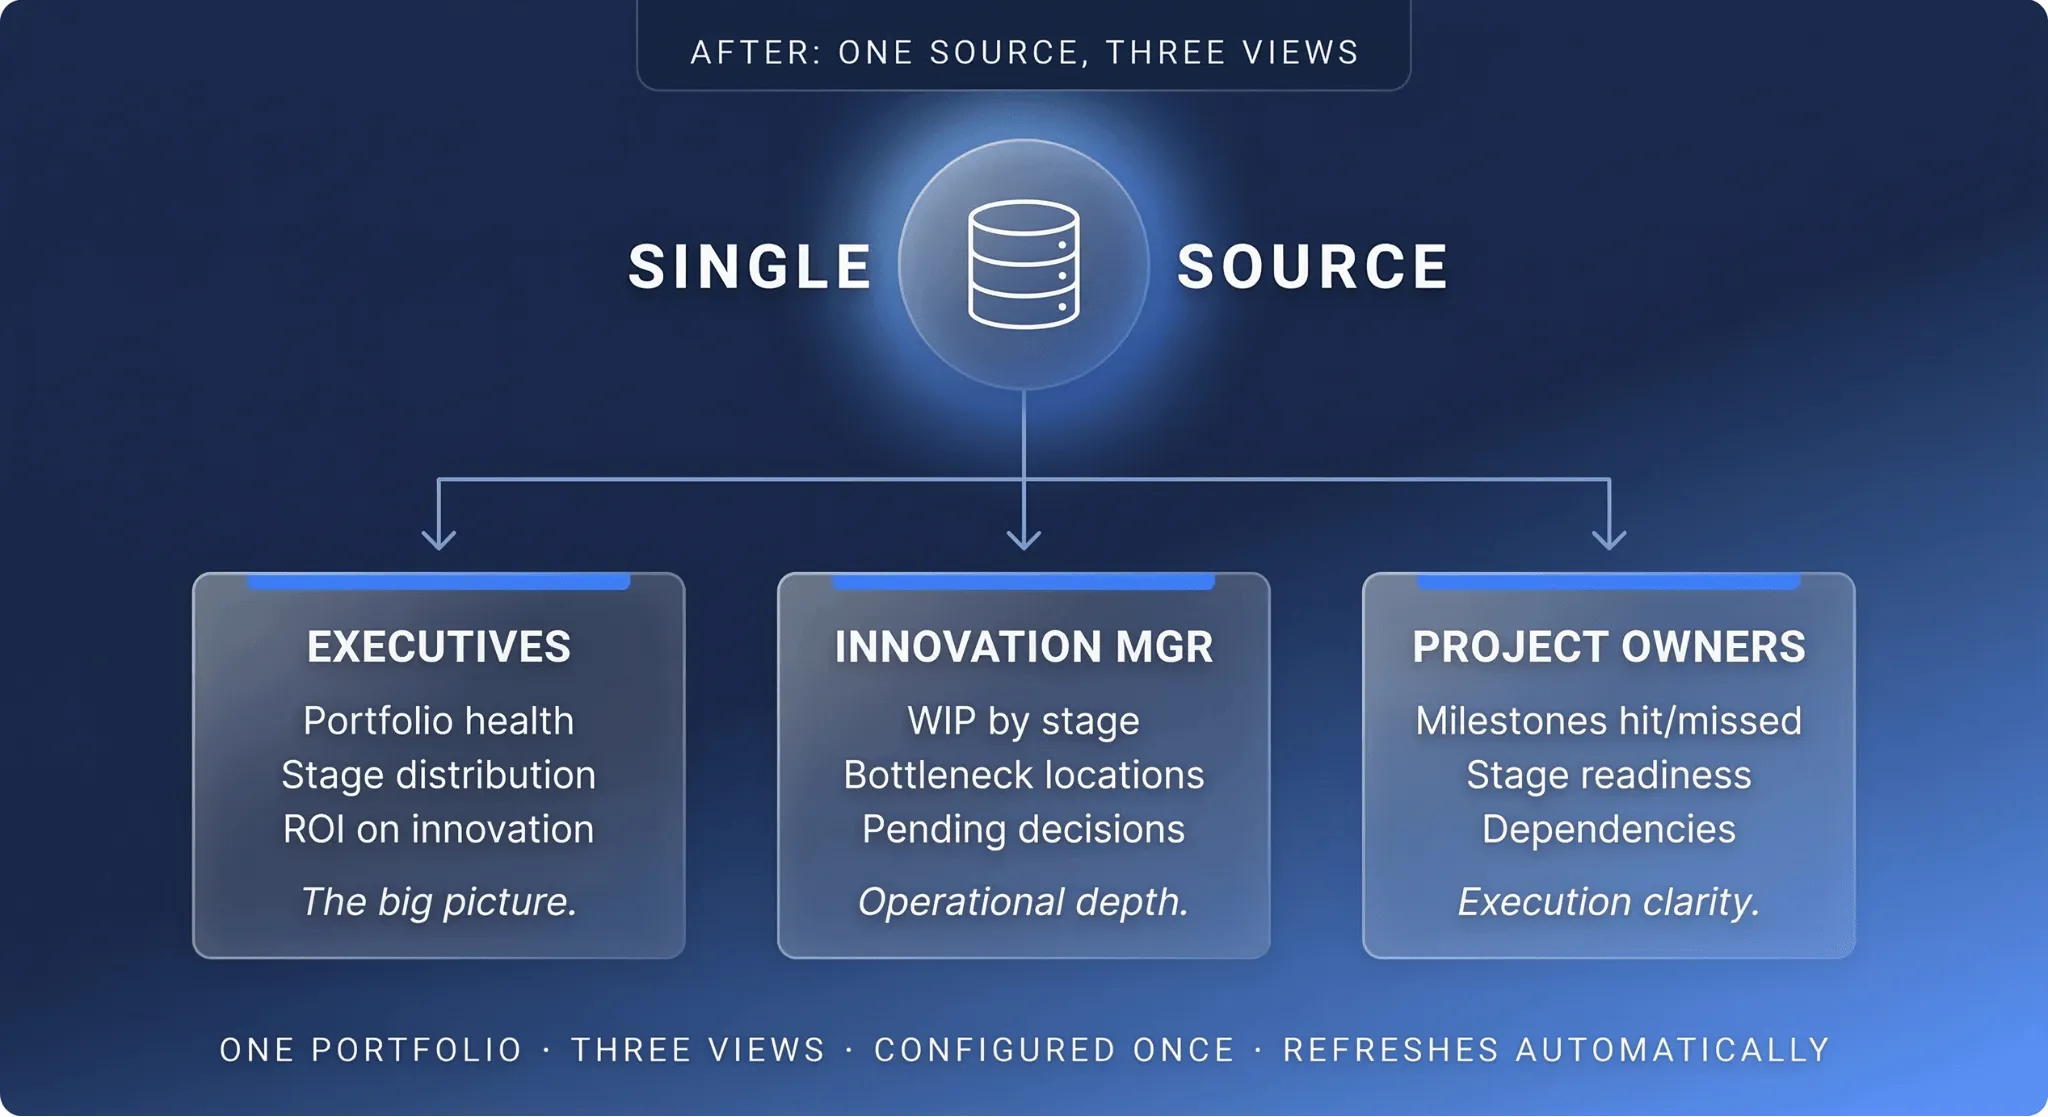
One source means one system with multiple views, each configured for the audience that needs it.
IBM’s strategic portfolio management framework calls this principle “visibility to all necessary stakeholders”: any change in the source is immediately visible to everyone who needs to see it.
| Audience | What They Need | Why It Matters |
|---|---|---|
| Executives | Portfolio health, stage distribution, resource alignment with strategy, ROI on innovation | Strategic decisions require the big picture, not details |
| Innovation Managers | Work in progress by stage, bottleneck locations, pending decisions, cycle times | Managing flow requires visibility into friction points |
| Project Owners | Milestones hit/missed, stage readiness, dependencies | Execution clarity on what’s next and what blocks progress |
One portfolio, three views, each configured once and refreshing automatically. When data updates in the source, all three views update with it, and your reporting cadence changes entirely.
The governance layer sits above this: who updates what, when, and who sees it. That’s an organizational decision, not a technical one.
Dashboard vs. Report: Not the Same Thing
The single source model supports both dashboards and reports, but they’re fundamentally different outputs.
| Dashboard | Report |
|---|---|
| Always on, live, and visual | Narrative snapshot at a specific moment |
| Role-configured for the viewer | Story-driven for executives or external audiences |
| Answers: Where are we? What’s changed? What needs attention? | Answers: How did we perform? What’s our health? What blocks us? |
| Stays current automatically as source data updates | Reflects latest underlying data, no manual refresh required |
The discipline is that both update from the same source and neither gets manually rebuilt.
A dashboard refreshes because data changes in the source; a report reflects the latest data rather than a manually refreshed version of the old one.
What Changes When You Make the Shift
First, the obvious: less time exporting, pasting, and formatting, and more time interpreting.
Real-world outcomes:
- Brewster consulting: Consolidated data across multiple project management tools. What took two months now takes two days.
- Investment management firm: Automated 80% of financial data extraction from external sources, shifting analysts from manual data entry to strategy.
- Accept Mission data: Organizations save 20-30% of the time typically spent on manual overviews, duplicate data entry, and ad hoc reporting.
That time moves from reconciliation to decision-making.
The AI advantage: AI surfaces anomalies like projects stuck in stage, flags stalled initiatives before leadership notices, and generates status summaries without manual effort.
But AI isn’t the engine.
The real shift is credibility. When leadership sees the same numbers from the same source, data disputes end. You can have actual conversations about priorities instead of arguing about which spreadsheet is real.
The Governance Your Source Needs
A single source delivers structure and transparency across your portfolio. But it breaks down without discipline.
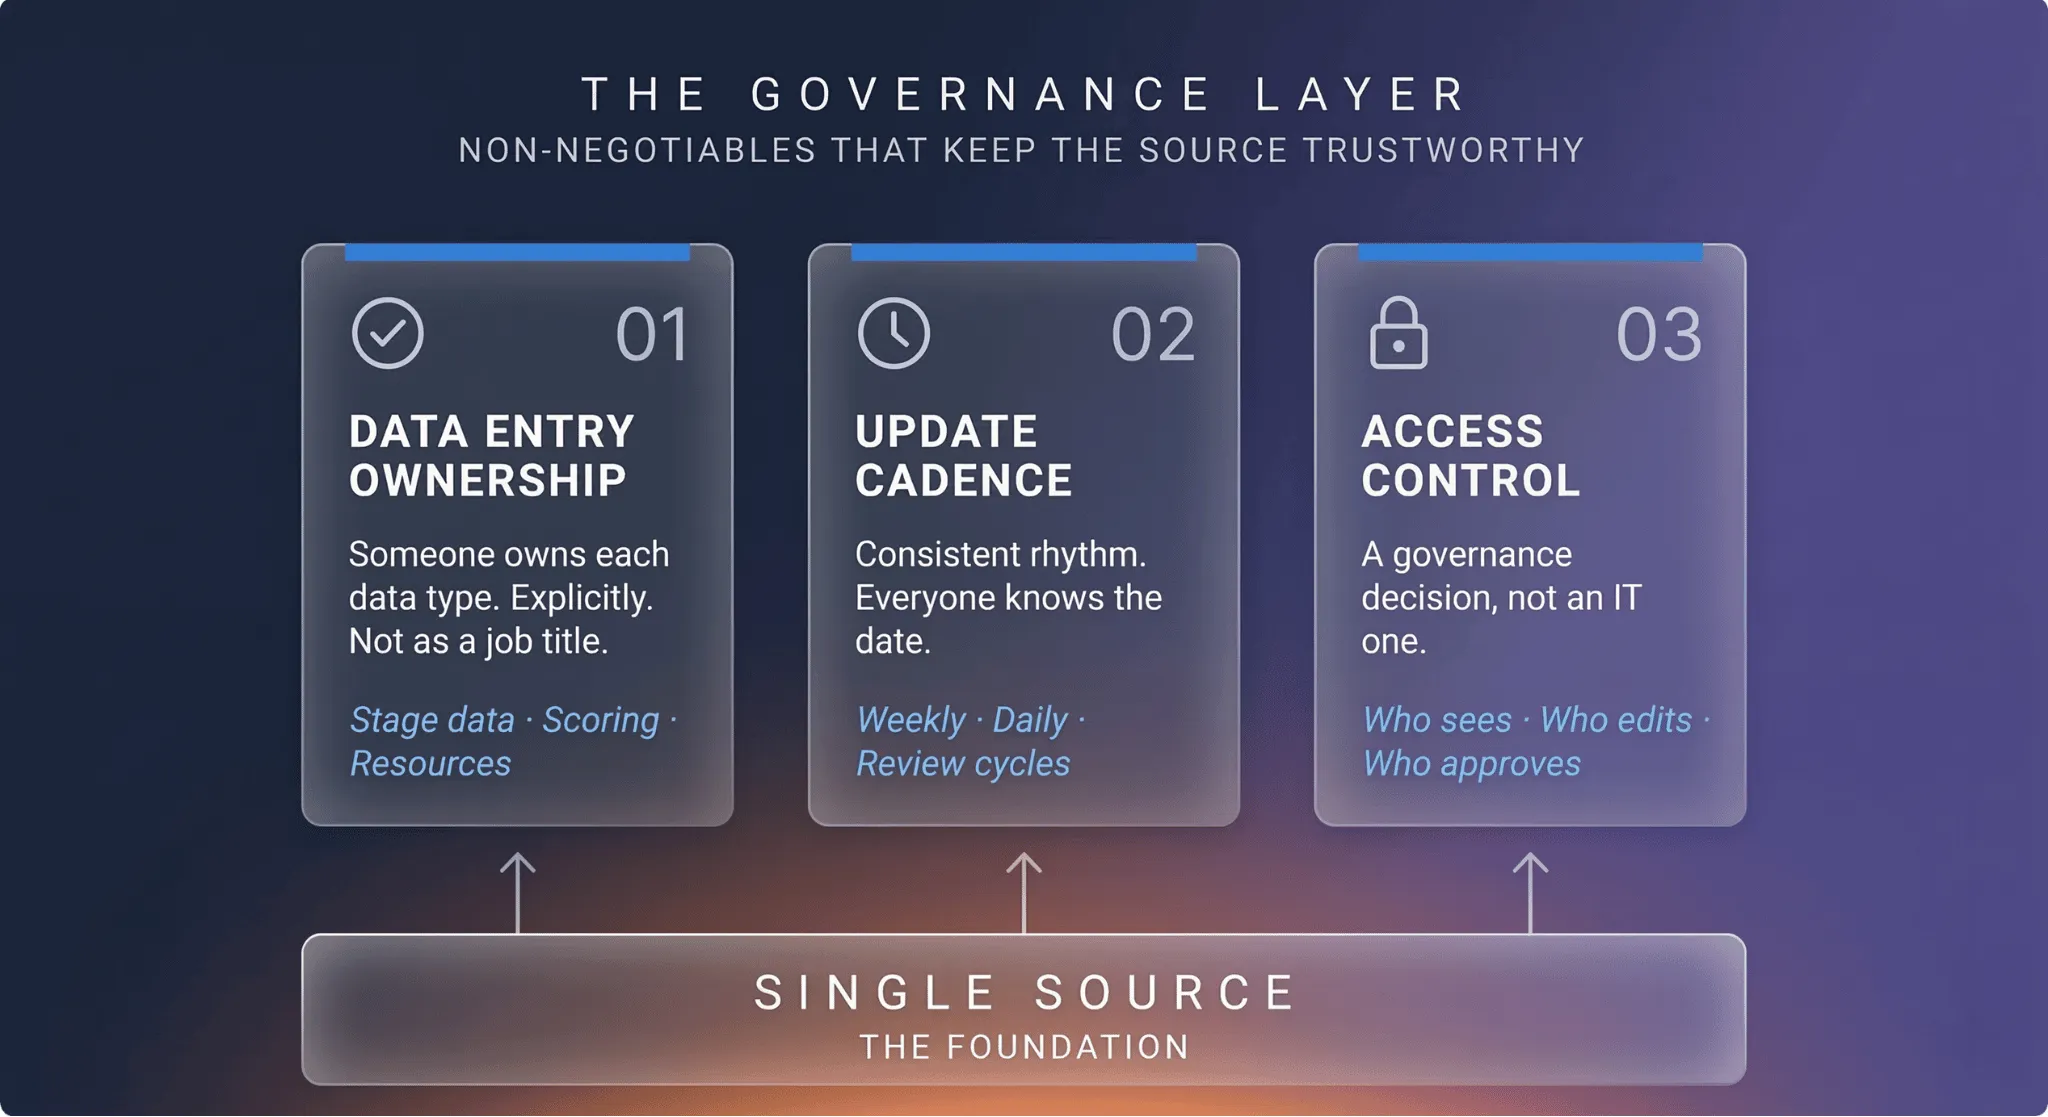
Three things are non-negotiable:
- Data entry ownership — Someone owns the stage data and updates it when a project moves, someone else owns the scoring inputs, and someone else owns resource allocation. Not as a job title, but as explicit assignment: “When a project advances to the next stage, you update the source. Full stop.”
- Update cadence — Consistency matters: weekly, daily, or tied to your review cycles. What matters is that everyone knows what date the data is current as of.
- Access control — This is a governance decision, not IT work: who can see which portfolio data, who can edit what, and what requires approval.
Gartner’s research on portfolio management is direct: “Siloed portfolios cannot work in isolation.”
Good tools fail without process. The most sophisticated reporting system can’t fix an organization where three different teams maintain three different versions of the truth.
The real work is organizational: deciding who owns the data, when it gets updated, and where it lives.
Start With What Already Breaks
You don’t rip and replace your entire portfolio management system. You start with the reporting moment that causes the most pain.
Which report do you rebuild most often, which one is driving the most time, and which one gets requested in ad hoc flavors constantly?
That’s your entry point.
Here’s the diagnostic sequence:
- Map the data sources feeding that report
- See where the reconciliation is actually happening
- Identify what data exists in multiple places
- Consolidate those sources into one system
- Migrate any parallel data
- Test that any authorized stakeholder can pull a current view without asking someone to build it
The test is simple: can someone log in right now and see an accurate, current portfolio view without asking you to create a deck?
If the answer is no, you have an operating model problem, and the fix is a decision about how your organization records and accesses information.
Reporting without rebuilding is the outcome of a structural choice.
Download our free ebook Project Portfolio: From Opportunities to Value to learn how to establish a single source of truth for your innovation portfolio.
Request a demo to see how Accept Mission gives you real-time visibility, automated reporting, and one unified source across your innovation portfolio.





 English
 Dutch
Dutch Portuguese
 Spanish
 French
 German
 Arabic