
The Hidden Reason Innovation Portfolios Stall: WIP Limits and Queue Health Explained11 min read

Most innovation teams don’t stall because of bad ideas. They stall because too many ideas are in motion at once.
The signs are recognizable:
- Too many active initiatives, almost nothing close to done
- Evaluation queues backing up, decisions that get pushed to the next meeting
- Portfolio reviews that circle the same ideas, meeting after meeting
The instinct is to blame talent, idea quality, or budget. Usually it’s none of those. It’s a workload design problem most teams never name, and it has a fix.
The fix is work-in-progress limits: a cap on how much can be active at once. Pair them with queue health and you get both a discipline and a diagnostic.
Why Innovation Portfolios Stall (Even When Everyone Is Busy)
Here’s the trap most portfolios fall into. They measure health by activity volume, not by flow.
It shows up in the questions they track:
- How many ideas are under review
- How many projects are in motion
These numbers describe a busy system. Busy looks like progress; it rarely is.
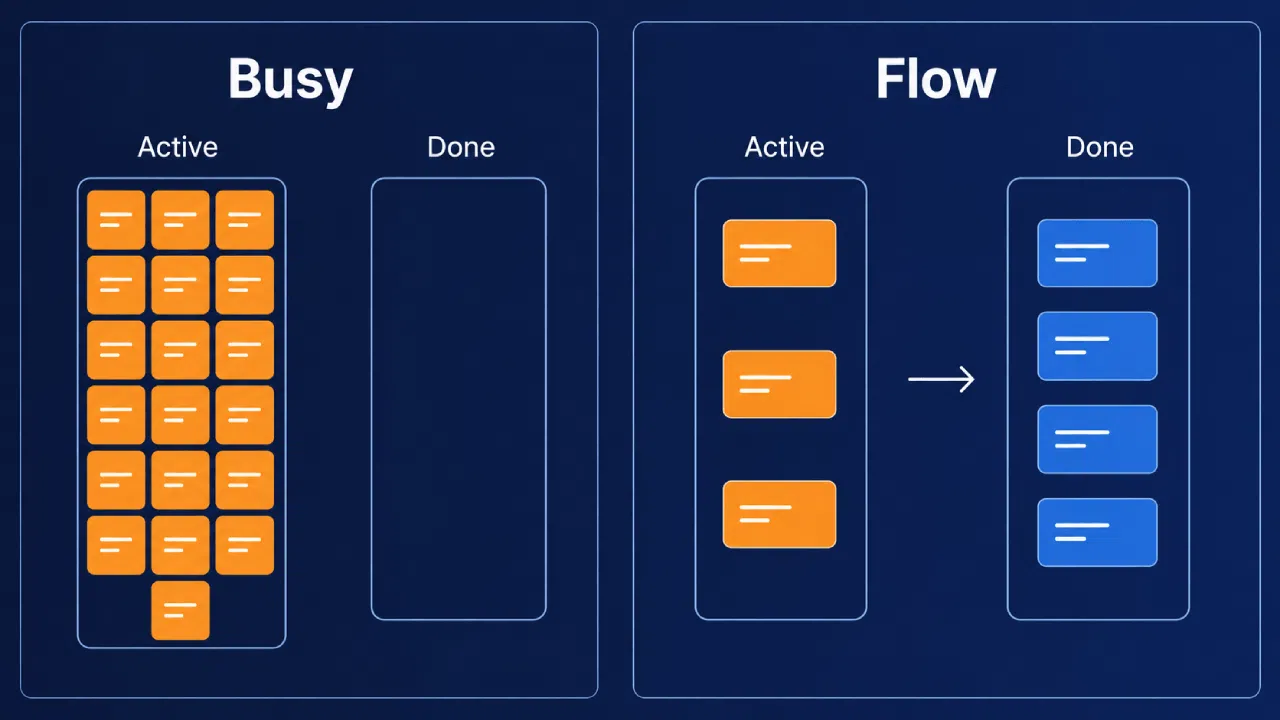
The data backs up the disconnect: only 21% of organizations definitively meet their innovation goals, and 63% rate themselves average or below average on speed to market.
When idea generation accelerates without matching downstream capacity, the bottleneck simply shifts to evaluation, governance, and resource allocation.
And there’s a subtler failure underneath it. Teams optimize one stage in isolation, speeding up intake while the validation queue chokes downstream.
The local fix looks like a win and the whole system moves no faster.
What WIP Limits Are (And Why They Belong in Innovation)
A WIP limit is a cap on the number of items allowed in a given stage at one time. Hit the cap, and nothing new enters until something exits.
The logic comes from queueing theory. In stable systems, lower WIP tends to produce shorter cycle times, consistent with what Little’s Law predicts when throughput holds steady.
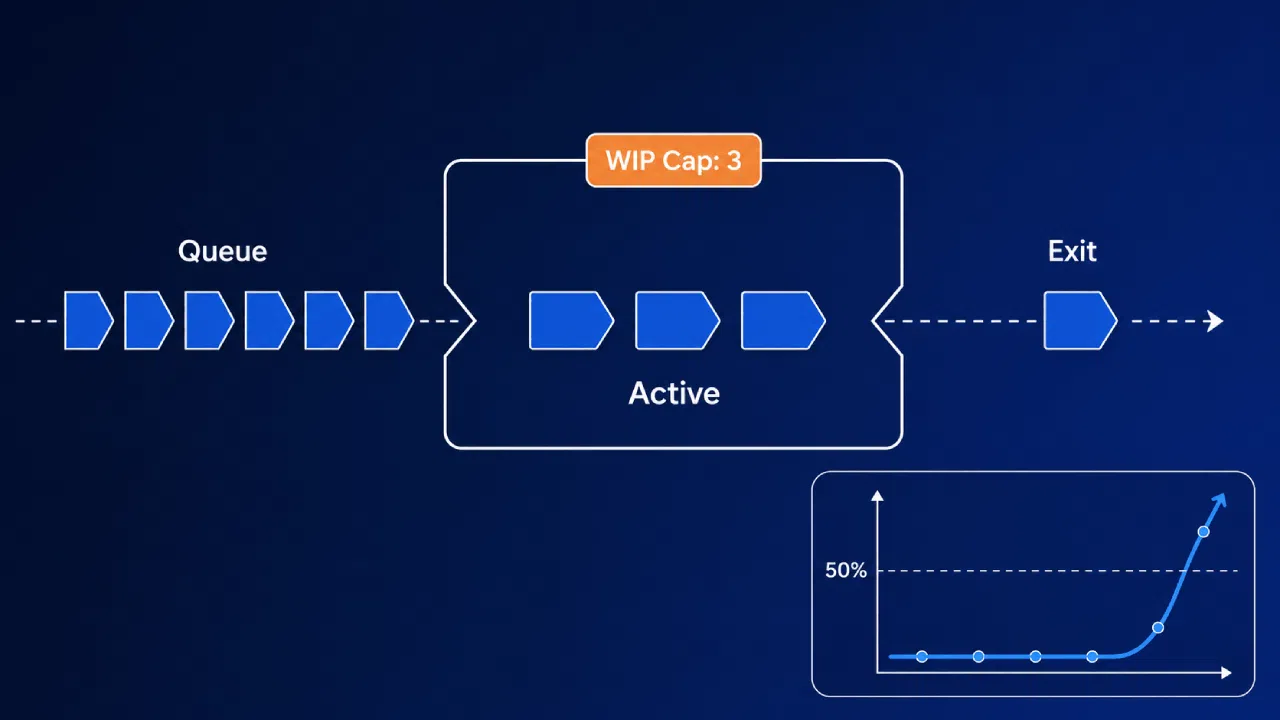
The same theory shows queues build smoothly below 50% utilization, then grow nonlinearly above it. Push a system toward full load and wait times explode.
There’s a caveat here. Lowering WIP only speeds delivery if the system is stable first; reducing WIP helps, but it’s not the only lever.
The core principle is almost uncomfortably simple: finishing matters more than starting. WIP limits make a team confront that truth on every decision.
Before You Set Limits: Establish a Baseline
Most teams set their first WIP limit by guessing. They pick a round number, drop it on the board, and hope it’s roughly right.
You can’t calibrate a cap without knowing queue depth and cycle times. A blind number is as likely to choke a healthy stage as fix a clogged one.
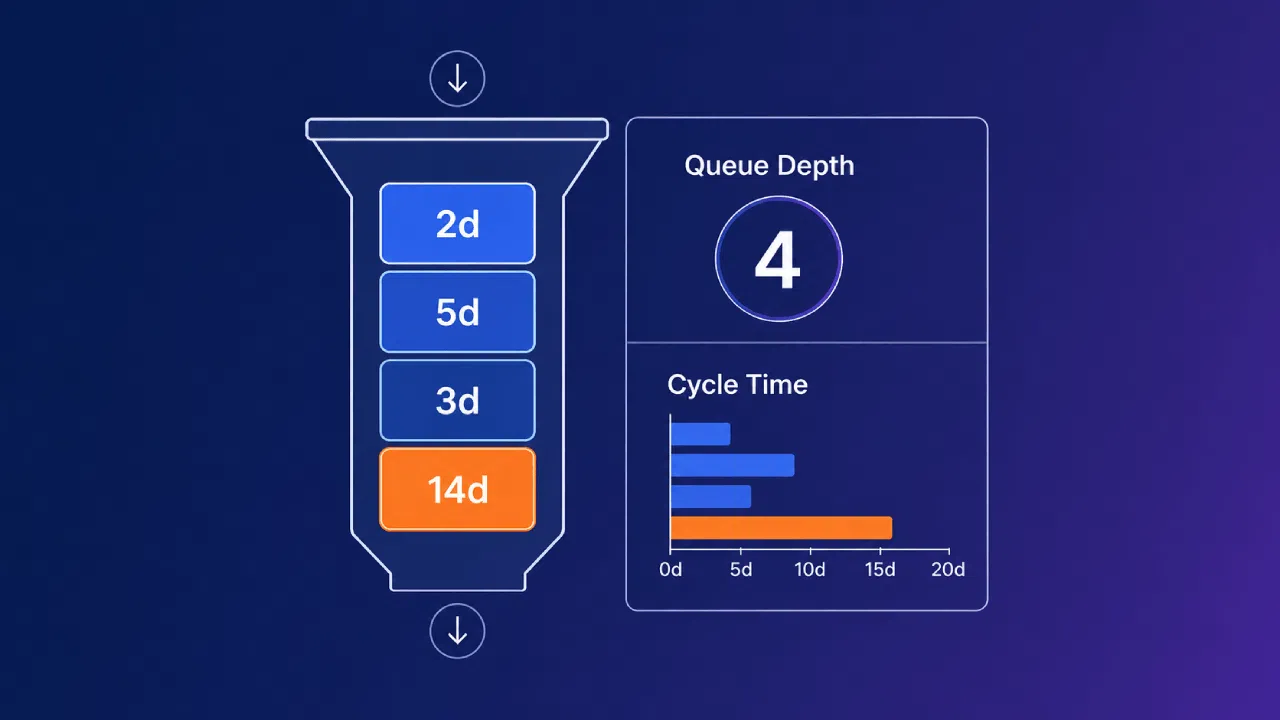
Baselining is simpler than it sounds, and takes just two moves:
- Track how long items actually sit in each stage over four to six weeks
- Count the active items in every stage right now
That’s it. No new tooling required to start, just honest observation.
Two things usually surface fast. First, teams find they already have an implicit WIP limit; it just hasn’t been enforced, so it drifts.
Second, the baseline exposes your real bottleneck. One stage is almost always where work goes to wait, and it’s rarely the one people blame.
Knowing that before you intervene changes everything. Set the tightest limit where the queue is actually backing up, not where it feels busy.
Setting WIP Limits by Innovation Stage
Limits work best when they’re stage-specific. An innovation funnel moves through ideation intake, evaluation and scoring, validation, and project execution, each with a different natural capacity.
Here’s a rough starting reference for each:
| Stage | Suggested Starting WIP | Signs the Limit Is Too Loose | Signs the Limit Is Too Tight |
|---|---|---|---|
| Ideation Intake | 1–2 per reviewer | Ideas pile up unreviewed; intake backlog ages | Promising ideas rejected just to free space |
| Evaluation and Scoring | 1 per scorer | Items sit days without a decision | Scorers idle while validated ideas wait upstream |
| Validation | 1 per small team | Multiple unvalidated bets run thin | A clear winner waits with no slot open |
| Project Execution | 2–3 per delivery team | Projects stall mid-flight, none ship | Resourced teams sit waiting for the next greenlight |
Two calibration methods help you find the right number. The floor approach starts deliberately small and raises the limit when the cap causes real pain.
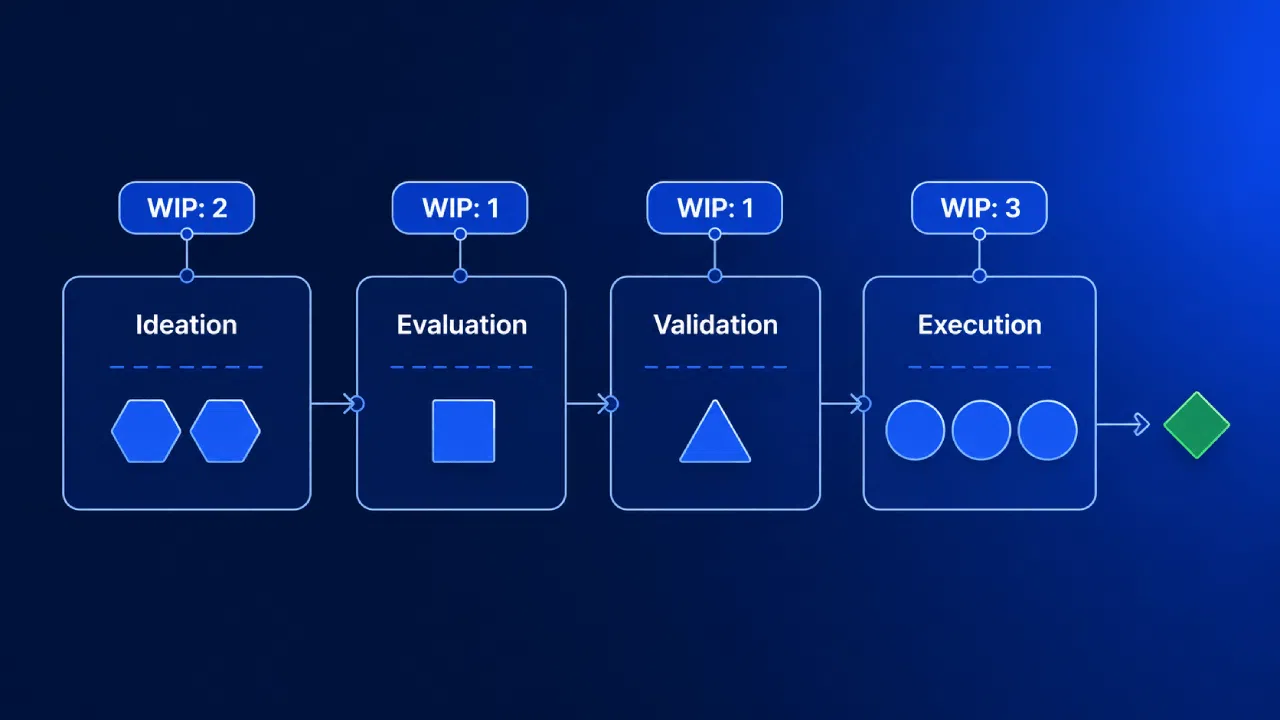
The ceiling approach starts high and tightens until you feel a useful constraint. A reasonable starting point is roughly one item per person per stage, then adjust from there.
There’s no universal number, so treat the first value as a hypothesis, not a rule.
One detail matters more than people expect: count initiatives, not the tasks inside them. A single validation effort with forty subtasks is one item in the queue.
Review these numbers at every portfolio sync. A limit set once and forgotten stops reflecting reality fast.
When a Slot Opens, What Fills It?
A WIP limit does something subtle. It turns “should we start this?” into a forced choice, every time a slot opens.
That moment is where portfolios reveal their real priorities. Something exits a stage, capacity frees up, and now a decision has to be made.
Without a framework, the decision defaults to whoever has the most pull.
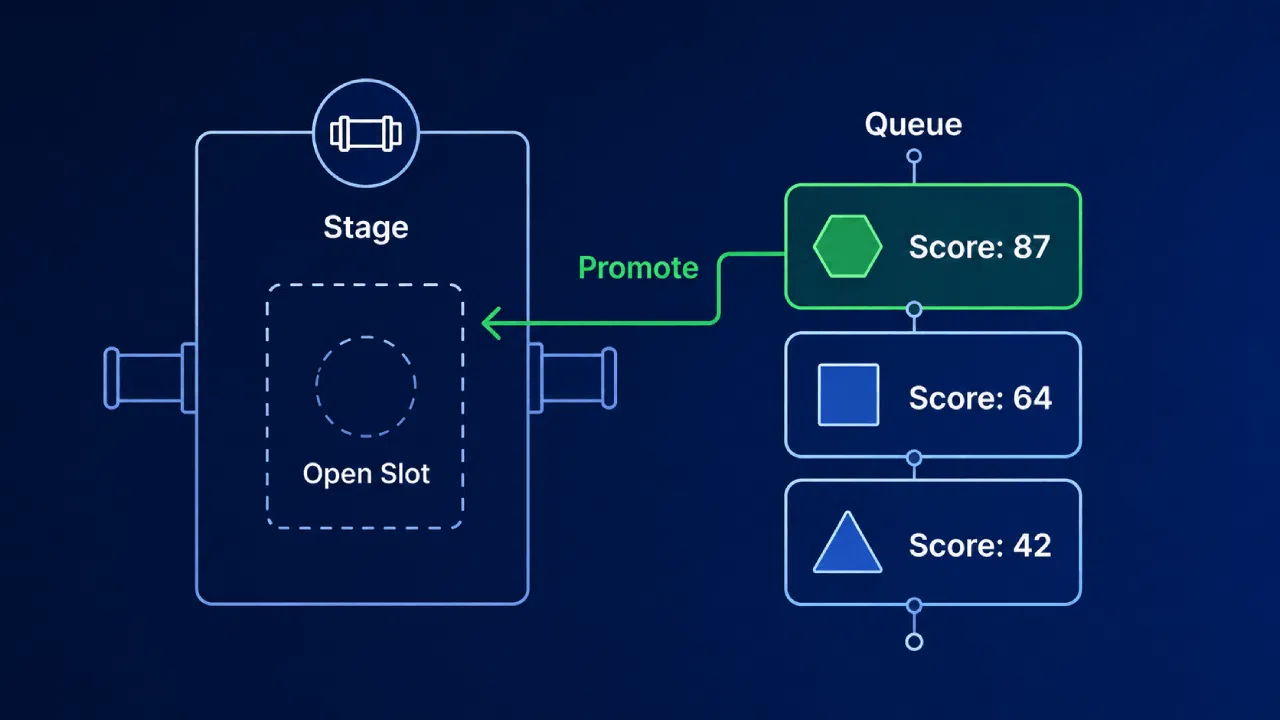
The loudest sponsor, the most recent idea, or whoever happened to ask first. None of those reflect strategic value; they reflect office dynamics.
Good prioritization under constraints looks different. Each queued item carries a score against consistent criteria: strategic fit, feasibility, market size, resource cost.
When a slot opens, you promote the highest-scoring item for that stage. The queue stops being a holding area and becomes an ordered list.
This is also what keeps the decision defensible. A sponsor can disagree with a score, but they’re arguing about criteria, not lobbying for a favor.
Queue Health: The Signal Behind the Limit
WIP limits are the policy. Queue health tells you whether the policy is calibrated correctly.
Watch for these warning signs:
- Bloated upstream queue. Items accumulate at intake faster than evaluation can clear them.
- Starved downstream stage. A capped stage sits empty because upstream isn’t feeding it validated work, so teams pull low-value ideas just to stay busy.
- Aging items. Initiatives linger in one stage well past their typical cycle time.
- Throughput drops with no WIP change. The same load now produces fewer completions, signaling a hidden bottleneck.
- Repeatedly deferred decisions. The same items get pushed to the next review, meeting after meeting.
Four metrics help you read each of these signals. Cycle time measures how long an item spends in a given stage.
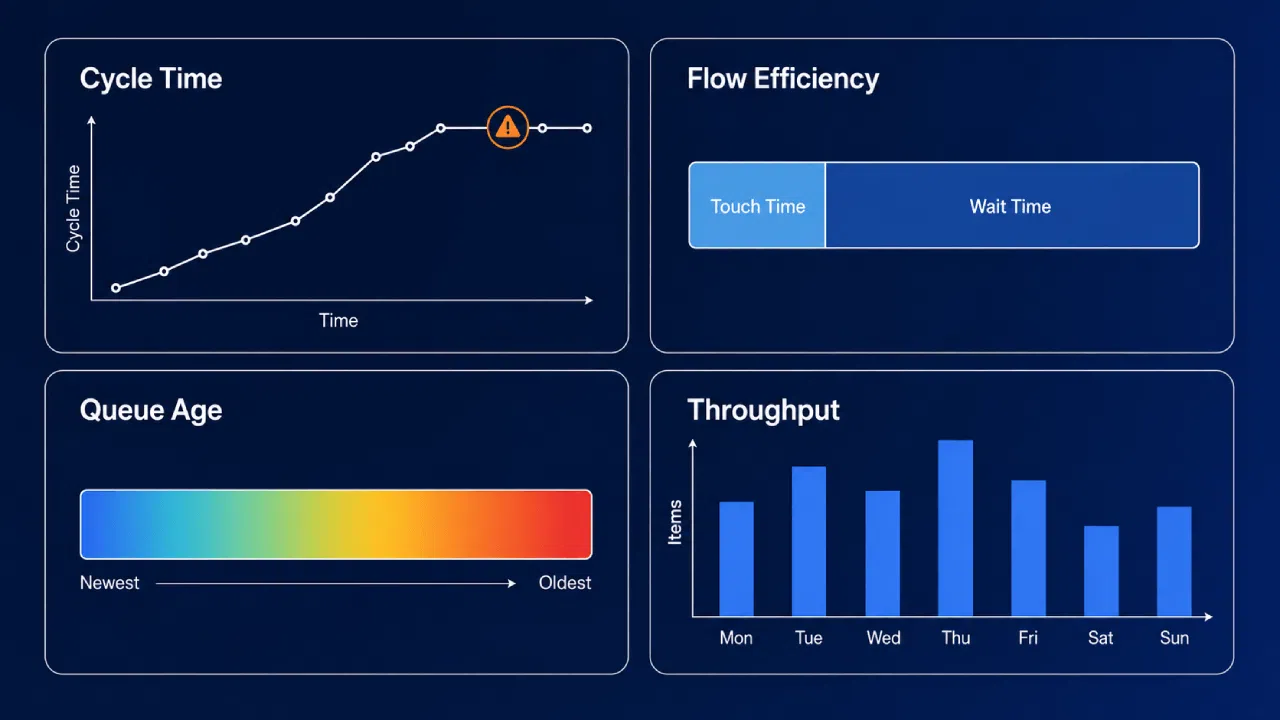
Flow efficiency, calculated as touch time divided by total cycle time, separates real value-add work from pure queue waiting.
Queue age tracks how long items sit without moving, and throughput counts how many items exit a stage per period.
Read together, these four expose where flow breaks, each pointing somewhere specific. That’s queue health: it converts a vague sense of “we’re stuck” into a located problem you can act on.
Adjusting Limits Over Time
A WIP limit is a hypothesis: the first number is a starting point. A tight one shows up as idle stages; a loose one looks like most portfolios already do.
Items pile up, cycle times creep, and aging work quietly accumulates at the back of the queue.
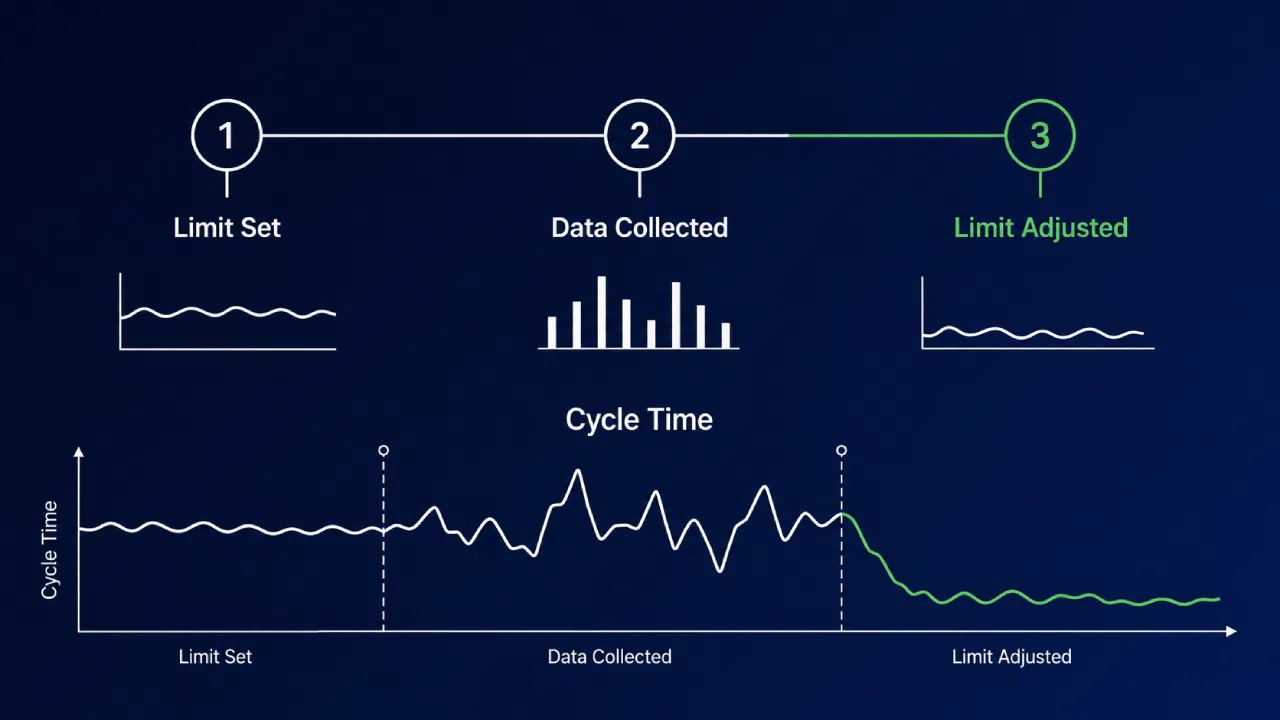
Resist the urge to react to a single rough cycle. One bad month is noise; a pattern across two or three cycles is signal.
Give the adjustment a rhythm. Revisit each limit at the quarterly portfolio sync, where you can see how the number behaved across a full stretch.
The goal is a cap that earns its place. If it’s doing its job, leave it alone, and put your attention on the stage that isn’t.
Why Teams Resist WIP Limits (And What the Evidence Shows)
Resistance is predictable, and it usually takes three forms. Here’s each one.
“We’ll miss good ideas.” A limit doesn’t delete ideas; it queues them. The alternative, starting everything, is what actually buries good ideas under stalled ones.
“Idle time looks bad to stakeholders.” This is the hardest objection, and the answer is data.
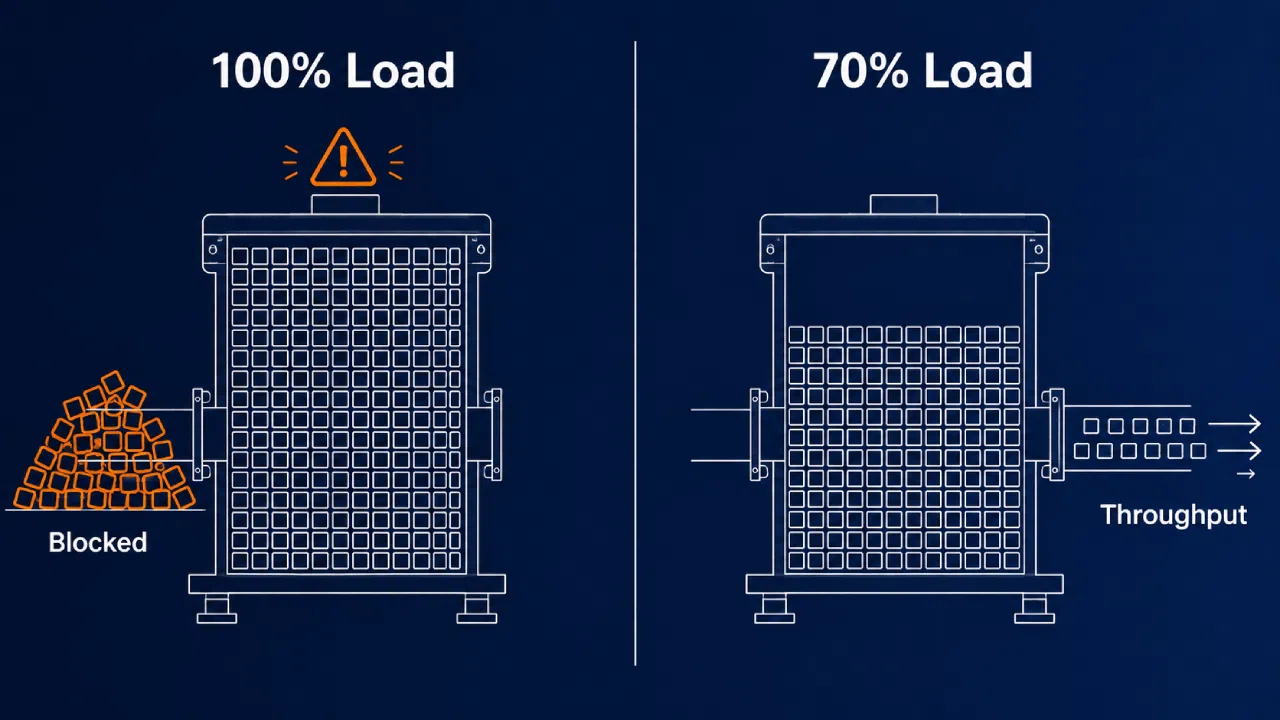
Reframe slack as throughput insurance and prove it with before-and-after numbers, because at 100% utilization there’s zero capacity left to move blocked work forward.
“Innovation can’t be capped.” The evidence cuts the other way.
At Siemens Health Services, enforcing WIP limits brought cycle times down to 43 days or less in the first Kanban release.
85% of stories in the following release finished within 41 days.
And here’s the counterintuitive part. Limiting WIP frees bandwidth to explore better solutions instead of juggling open tasks, a consistent pattern across teams that have implemented the discipline.
WIP Limits and the Portfolio Review Cadence
Most innovation teams review the portfolio on a fixed calendar. Monthly, quarterly, whatever the governance deck says.
The flaw is that the calendar has no idea what the pipeline is doing.
A slot can open mid-month and sit empty for weeks, waiting for the next meeting. WIP limits fix this by tying decisions to state, not dates.
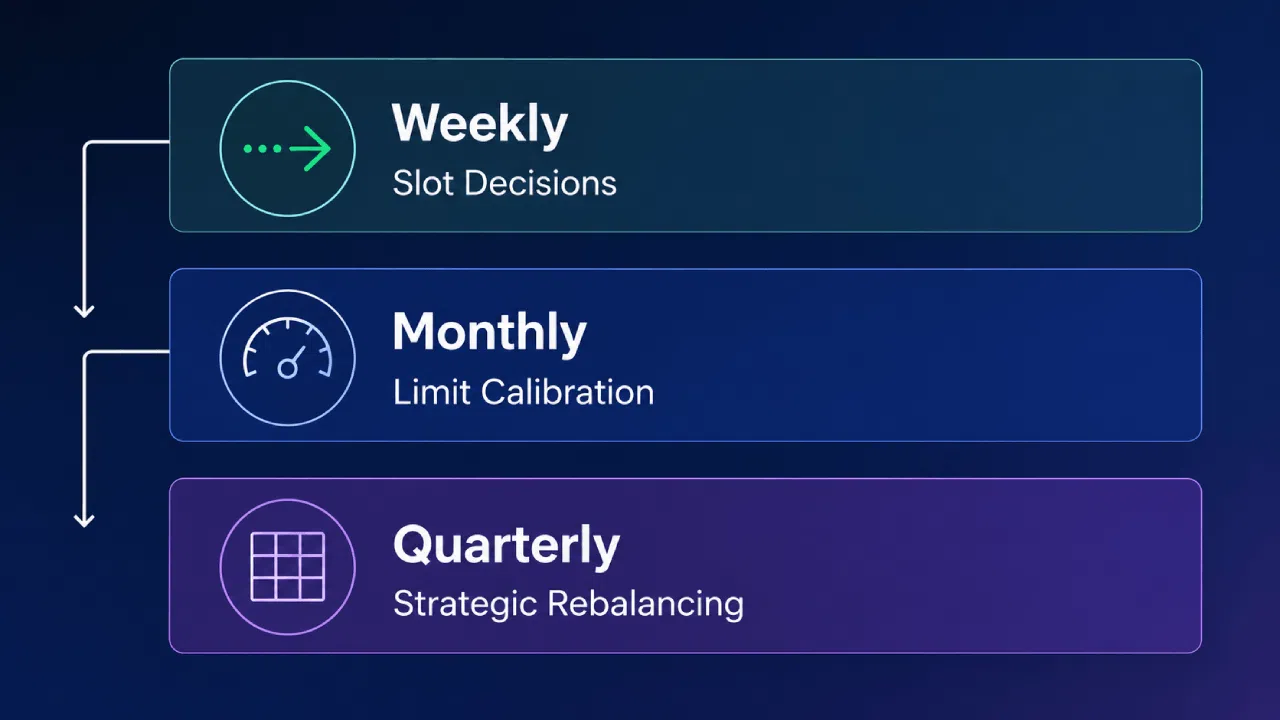
When a stage hits its cap or empties out, the pipeline’s state becomes the trigger for the next decision.
In practice, that means layering the cadence. Run a weekly or bi-weekly check-in to handle slot decisions as they come up.
Keep the monthly review for calibrating limits, and reserve the quarterly for strategic rebalancing. Each rhythm does one job well.
The shift is from scheduled to triggered governance. Decisions happen when the system needs them, usually before the meeting would have caught up.
Workload Policies in Practice: What Makes Them Stick
A WIP limit written in a policy document is a suggestion. A WIP limit on the board everyone watches is a rule.
This is where a portfolio platform does real work, in two ways that keep limits honest:
- Real-time dashboards that track stage load, queue age, and throughput, keeping the signals visible and out of spreadsheets.
- AI-assisted prioritization that surfaces which queued item deserves the next open slot, maintaining decision quality when capacity is deliberately constrained.
That distinction decides whether any of this survives contact with a busy quarter.
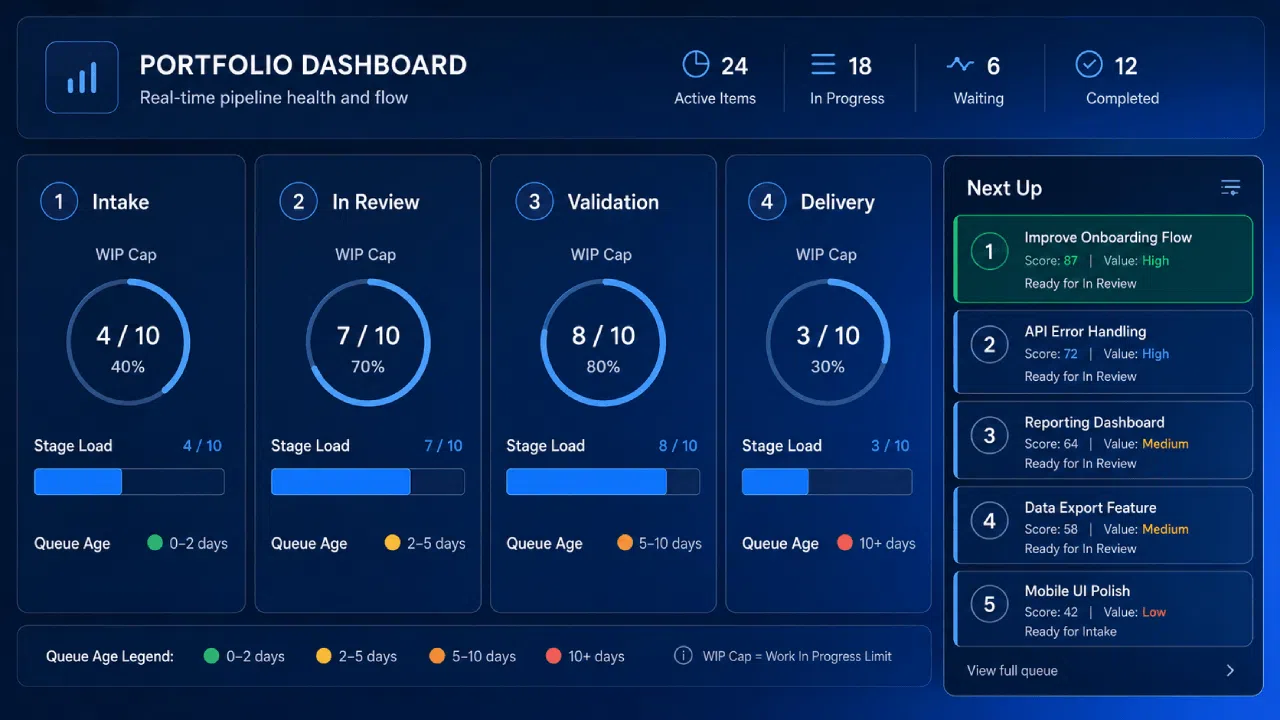
None of this is AI for its own sake. It fits contextually and without drama, doing its work at the exact moment a slot opens.
Teams running structured governance and real-time portfolio visibility consistently move more work through the funnel with less overhead.
The board everyone watches becomes the place decisions actually get made, not the policy doc nobody reopens.
Build a Portfolio That Finishes
A busy innovation portfolio isn’t a healthy one. Activity is easy to generate; throughput is what actually moves the business.
To make workload limits stick, focus on three things:
- Set a WIP limit in the stage where the queue backs up most
- Track the four health signals: cycle time, flow efficiency, queue age, and throughput
- Revisit the limits after two or three cycles, not after one rough month
The first bottleneck you find won’t be the last, but it’s the most valuable. It tells you more about where your pipeline breaks than any activity metric has.
Stalled portfolios rarely have a strategy problem: the culprit is almost always workload design. Now you have the framework to find it.
Accept Mission’s funnel views and portfolio dashboards make this visible in real time, tracking stage load, queue age, and throughput across the full portfolio.
Teams running on the platform report 20–30% time savings in managing innovation projects, with governance, throughput tracking, and visibility that keeps the portfolio moving.
Download our free ebook Project Portfolio: From Opportunities to Value to learn how to turn a crowded pipeline into a portfolio that consistently delivers.
Request a demo to see how Accept Mission tracks stage load, queue health, and throughput so WIP limits hold and the portfolio keeps moving.








 English
 Dutch
Dutch Portuguese
 Spanish
 French
 German
 Arabic