
Speed Up Your Stage-Gates: Business Case, Risk, and Experiment Templates18 min read

Picture a gate meeting booked for 90 minutes. The first hour goes to questions the business case should have answered on paper.
The reviewers keep re-asking the same things:
- Which revenue numbers are estimates, and which are tested?
- What kills this if it’s wrong?
- What has the team learned since the last gate?
- What exactly are we being asked to fund, and for how long?
None of those questions is new. The team just wasn’t asked to answer them in advance, so the gate does the writing live.
Templates speed a gate up, but only when 3 documents share one spine. The business case, risk log, and experiment plan need one set of assumption IDs.
With that link, the gate reads what changed and commits resources for the next stage. Below are 3 copy-ready templates, with one cost-savings pilot running through all 3.
Why Gates Slow Down Before Anyone Decides
In the slow gates we’ve seen, the time goes before the decision starts. Reviewers spend it reconstructing what the team believes.
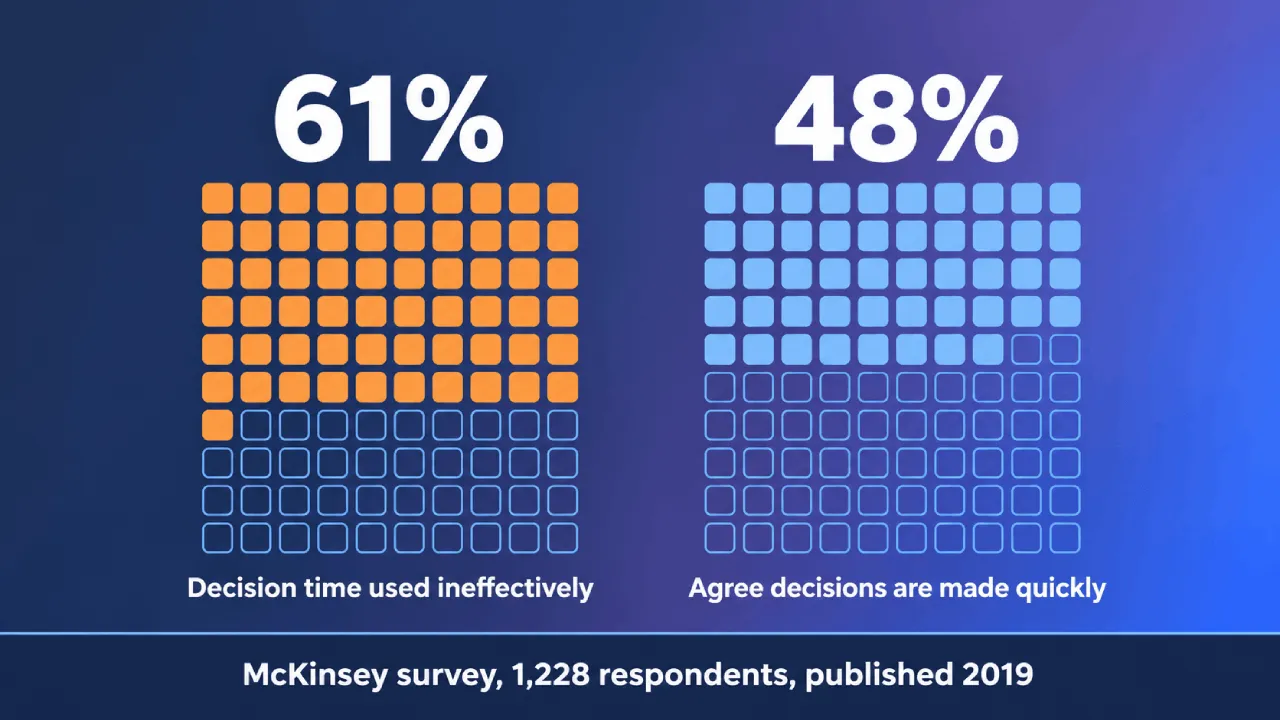
A McKinsey survey published in 2019 found a similar drag in decision making generally:
- 61% said most of their decision-making time is used ineffectively.
- Only 48% agreed their organizations make decisions quickly.
Those figures cover decision making at large, from 1,228 respondents. Gates have a sharper version of the same problem.
McKinsey’s Gupta, Smits, and Weig describe the gate version:
“Too often, stage-gate meetings are little more than reviews of product maturity, with limited focus on decision making.”
They also name the incentive gap: “Given that funding is rarely delayed or halted at a traditional stage gate, participants have little incentive to prepare for decision-oriented discussions.”
So teams bring a status update, each formatted their own way. Reviewers then translate it into the same few questions, gate after gate.
Which means the gate spends its time on reading comprehension. The resource decision, the one call only the gate can make, gets whatever minutes are left.
A Template Is the Gate’s Questions, Written Down Early
Official guidance assumes this.
The U.S. Department of Energy’s 2007 stage-gate guidelines judge projects “against a set of criteria that are defined at the outset of each stage.”
The same guidelines list what happens at each gate:
- A decision to go ahead, delay, or stop
- Funding approval for the next stage
- An approved path forward for that stage
But the key point is about timing. The criteria are “preset,” so “gatekeepers can make objective and timely decisions.”
McKinsey’s decision-gate authors describe the working version the same way:
“Preparation for meetings is thorough and guided by standard templates, and the meetings are meaningful but short.”
In other words, a template is the gate’s questions, written down before the team starts working. Nobody has to guess what the reviewers will ask.
Each of the 3 templates below answers a specific set of reviewer questions in advance, so your gate reaches the resource call sooner.
Three Templates, One Chain
Templates speed up a gate only if they hand off to each other. The business case, risk log, and experiment plan should read as one argument.
The linking idea isn’t new. In Discovery-Driven Planning, Rita McGrath and Ian MacMillan described a discipline “captured in four related documents.”
Their set, from the 1995 Harvard Business Review article, runs like this:
- A reverse income statement, modeling the basic economics
- Pro forma operations specs, laying out the operations needed
- A key assumptions checklist, so assumptions actually get checked
- A milestone planning chart, which “specifies the assumptions to be tested at each project milestone”
Each document is updated “as the venture unfolds and new data are uncovered.” The milestone chart even lists assumptions “with appropriate numbers from the assumption checklist.”
The numbering was there from the start, but in our experience, the link breaks once each document lives in its own folder with a separate owner.
McGrath and MacMillan’s answer was a “keeper of the assumptions,” a named person who makes sure each milestone’s checks happen.
Without one, they warn, people “up to their armpits in project pressures” are unlikely to coordinate the updates. Name that person before the 1st gate.
Shared IDs Hold the Chain Together
What we’d add is the risk log. Carry the same assumption IDs (A1, A2, A3) into it, so all 3 templates share one key.
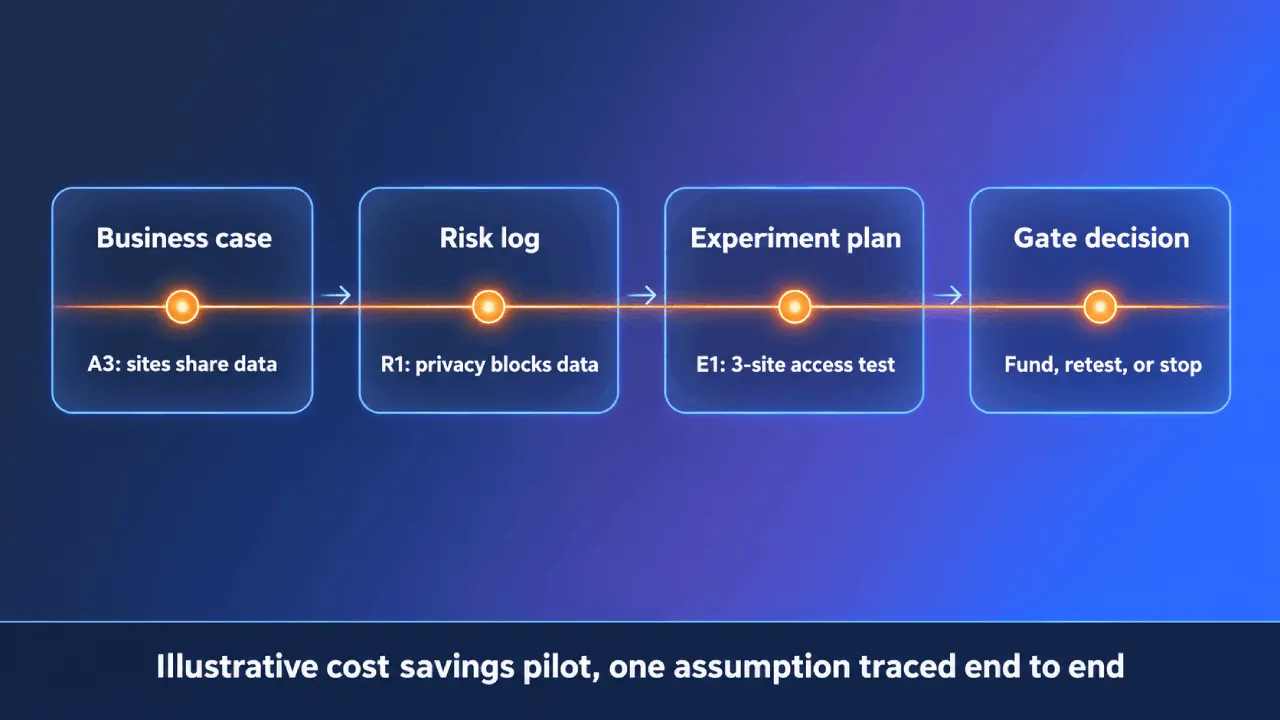
Here’s how the chain runs, gate to gate:
- Business case: numbers its key assumptions, A1 onward.
- Risk log: ranks the risks that would kill the project, each tagged with the assumption ID it threatens.
- Experiment plan: tests the top-ranked assumptions before the next gate, with pass and stop thresholds set in advance.
- Gate: reviews what changed since last time, then commits resources for the next stage.
With shared IDs, a reviewer can trace each top-ranked assumption to its risk and its test. Without them, the gate re-asks.
That trace is what makes the gate fast, because nothing has to be reassembled in the room.
Shared IDs also change what the gate reads. Reviewers see which assumption IDs moved since last time, with the evidence attached.
The Business Case Template
The business case starts the chain, so its job is narrow on purpose. It states what the project must deliver and which assumptions that depends on.
Start From What the Project Must Earn
McGrath and MacMillan open with the reverse income statement, which “runs from the bottom line up.”
You start with “required profits,” then work back to the revenue and costs that would have to hold. Every one of those becomes an assumption.
The order matters. Built from revenue down, a forecast can quietly rise until it just clears the hurdle.
Built from required profit up, the question flips. How many customers, at what price and margin, would the project need, and does anyone believe that?
The Business Case Fields
Here’s the field set we’d start with, plus a cost-savings pilot we’ll follow through all 3 templates. Each field answers a question your gate would otherwise ask out loud.
| Field | What It Answers | First Gate | Later Gates | Example (First Gate) |
|---|---|---|---|---|
| Decision and ask | What’s the gate deciding? | Go, stop, or rework, and what it funds | Same, plus the evidence behind it | Go: fund a 6-week data-access test at 3 sites |
| Problem and strategic fit | Why this, and why now? | One paragraph, tied to a strategic theme | Updated if strategy or evidence shifted | Site operating costs, tied to the cost-reduction theme |
| Required outcome | What must it earn or save? | Rough profit or savings target | Target checked against tested assumptions | Savings large enough to repay a full rollout |
| Key assumptions (A1, A2…) | What has to be true? | Numbered list, mostly untested | Same IDs, each marked tested or open | A1 savings per site, A2 rollout cost, and A3 pilot sites will share their operating data |
| Options considered | What else could we do, including nothing? | Do nothing plus 1 or 2 alternatives | Preferred option, with reasons | Do nothing, outsource the analysis, or run the pilot |
| Cost and time to next gate | What does the next stage cost? | Rough range | Committed budget and dates | 2 person-weeks over 6 weeks |
| Confidence per estimate | How solid is each number? | Mostly indicative | Tested or baselined | A1, A2, and A3 all indicative |
Two fields do most of the work. Numbered assumptions feed the risk log, and the confidence field tells reviewers which numbers are deliberate guesses.
Label each estimate as indicative, tested, or baselined. That’s our scale, and any 3-step label works if the whole portfolio uses it.
Government guidance stages business cases too: the UK Treasury’s Green Book moves a project through a Strategic Outline Case, an Outline Business Case, and a Full Business Case.
Its 5 cases (strategic, economic, commercial, financial, and management) are “closely interconnected perspectives on the same proposal,” developed “through an iterative process.”
We’d borrow that pattern. With these fields, your gate stops re-asking 2 opening questions: which numbers are tested, and what exactly it’s funding.
The Risk Log Template
A register built only to be complete fails the gate in a predictable way. It lists everything, and nothing is ranked against the business case.
The fields themselves are well established. The UK government’s Teal Book describes each risk “in terms of cause, event and impact.”
It adds an owner, likelihood and impact scores, a response, and a residual rating. Then velocity, or “how quickly the risk would affect objectives should it occur.”
On ranking, Shrivastava’s 2012 PMI Global Congress paper is plain: “risks that have high probability and high impact appear at the top of the risk register.”
The Risk Log Fields
We’d keep a short core from that list and add 2 columns. Linked assumption and Test are the ones that connect the log to the chain.
Back to the cost-savings pilot, whose A3 reads: pilot sites will share their operating data. Here’s that assumption’s risk entry:
| Field | What to Write | Example |
|---|---|---|
| Risk ID | R1, R2… | R1 |
| Linked assumption | The assumption ID it threatens | A3 |
| Risk statement | Cause, event, and impact | Privacy concerns stop sites sharing data, so savings can’t be proven |
| Owner | One named person | Site operations lead |
| Likelihood and impact | Scored on your house scale | High, high |
| Velocity | How fast it would hit | Immediate: no data, no savings proof |
| Response | What you’ll do about it | Reduce: offer sites an anonymized data-sharing agreement |
| Test | The experiment ID that settles it | E1 |
| Residual rating | Rating after the response | Medium (expected until E1 reports) |
No standard register we found links a risk to the assumption it threatens. That link is our design choice, and it’s what makes the chain work.
It also exposes a quiet failure. A risk with no linked assumption points to a missing link, or to an assumption the business case never wrote down.
Software can catch that gap, flagging any risk with no linked assumption or test. People still rank the risks and make the call.
Cap What Reaches the Gate
Even a ranked register runs too long for the gate. So don’t ask reviewers to weigh 40 risks in one meeting.
That’s why we’d split the register in 2 for the gate:
- Gate pack: the top 5 risks by likelihood and impact, each naming an assumption the required outcome depends on
- Appendix: everything else, kept current by the risk owner
The Teal Book weighs responses the same way. It asks for responses that are “proportionate,” balancing their cost “against the probability and impact of the risk occurring.”
And if a top-5 risk doesn’t name an assumption, the business case and the risk log are telling different stories.
That’s the speed gain from a capped, linked log. Reviewers stop asking what kills the project, because your top 5 already answer it.
The Experiment Plan Template
The experiment plan turns ranked risks into evidence before the next gate. Its key field is the easiest one to skip: a pass line written before the test runs.
The Cabinet Office’s Test, Learn, Adapt paper states that rule plainly, in 2 instructions:
- “define at the outset exactly what outcome we are trying to achieve and how we will measure it”
- “to stick with these prespecified outcomes at the analysis stage”
The paper was written for randomized trials, but the principle transfers to any gate test.
The GOV.UK Service Manual points the same way for its alpha phase: “A crucial part of alpha is identifying your riskiest assumptions and testing them.”
Teams justify the move to beta “using the success metrics you identified at the end of discovery.” The discovery guidance even says it’s “not a failure to stop” there.
There’s correlational support too. PMI’s 2024 research associates defining success criteria upfront with a Net Project Success Score of 41, against 20 without.
Those are self-reported scores from general projects, but the direction matches the rule: decide what counts as success first.
The Experiment Plan Fields
One plan per tested assumption keeps the trail clean. These are the fields we’d use, continuing the risk log example:
| Field | What to Write | Example |
|---|---|---|
| Experiment ID | E1, E2… | E1 |
| Assumption tested | The assumption ID | A3 |
| Hypothesis | What you expect, stated so it can fail | At least 2 of 3 pilot sites will share 8 weeks of usable operating data |
| Method | Cheapest test that would settle it | Anonymized data-sharing agreement offered to 3 sites |
| Metric | What you’ll measure | Sites delivering the agreed data fields within 6 weeks |
| Pass threshold | Result that keeps the assumption | 2 or more of 3 sites deliver |
| Stop or rethink threshold | Result that kills or reshapes it | No site delivers |
| Cost and timebox | Spend and weeks allowed | 2 person-weeks, 6 weeks |
| Owner | One named person | Site operations lead (R1’s owner) |
| Decision it feeds | What the next gate decides with it | Fund the savings pilot, run a sharper access test, or stop |
Set both thresholds before the test starts, and keep the gap between them narrow. A wide gap leaves too many results that decide nothing.
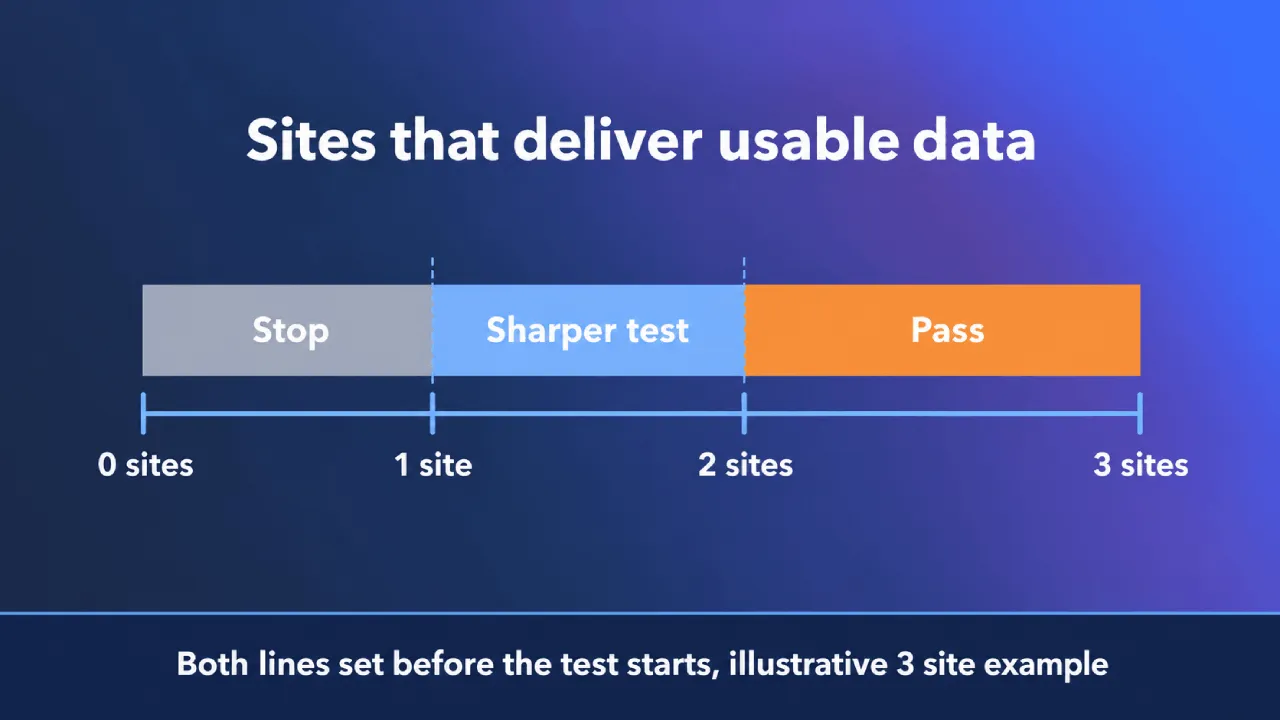
Notice the example’s middle case: 1 site delivers. It lands between the lines, so the team owes the gate a sharper test.
And the table’s last field is the filter that matters. If no gate decision changes with the result, the experiment is research, and it belongs outside this gate pack.
So this plan takes the last open question off the agenda. Each result lands against lines drawn in advance: pass, stop, or a sharper test.
Sequence by Risk and Cost
Which assumption do you test first? The sources point 2 ways:
- GOV.UK alpha guidance: points at the riskiest assumptions
- Rita McGrath’s 2008 getting-started post: “try to put the least expensive milestones in early, leaving the more expensive or risky ones for later”
The 2 rules pull against each other, so we’d combine them. Rank by risk, then run the cheapest test that would settle the top-ranked assumption.
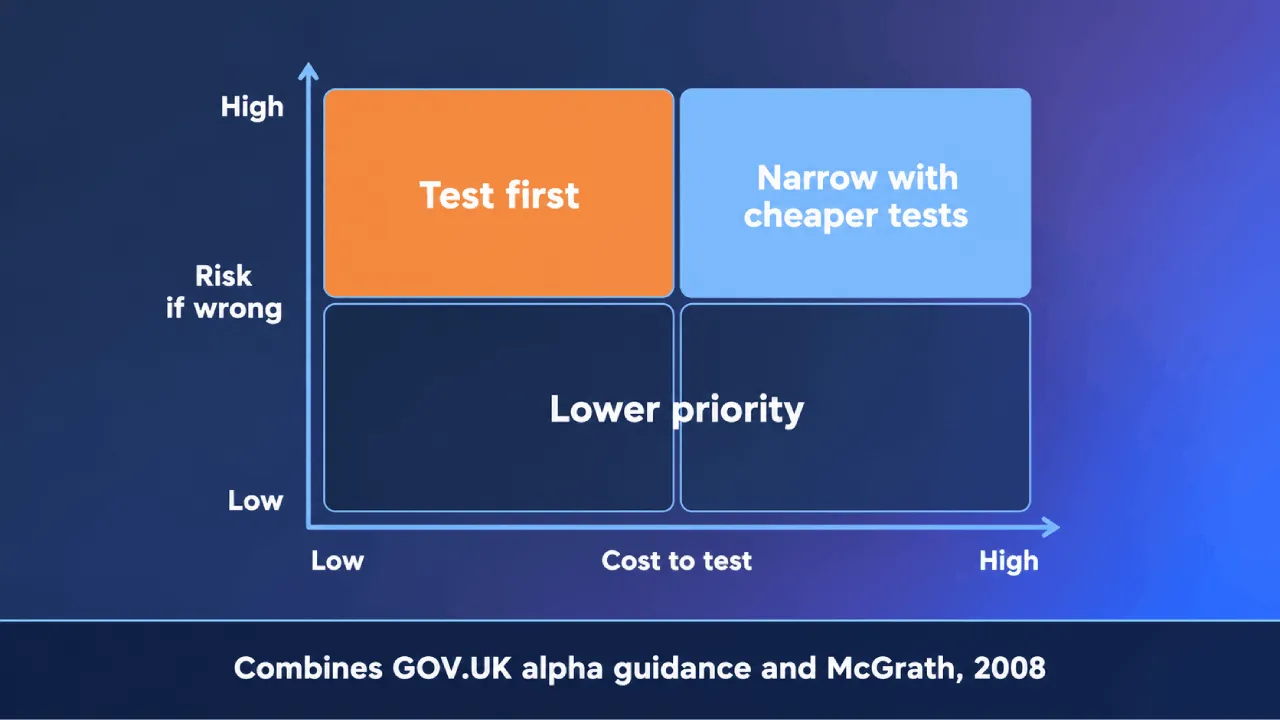
A kill-level assumption that’s cheap to test goes first. An expensive one waits until cheaper tests have narrowed it, where they can.
McGrath’s reminder about assumptions applies to all of it: “The critical thing is to write them down!”
Same Fields, Deeper Answers at Every Gate
A new document per gate restarts the argument, since reviewers lose their bearings. A living set of the same 3 templates lets them read the delta.
Here’s how the same fields deepen across early, middle, and late gates:
| Item | Early Gate | Middle Gate | Late Gate |
|---|---|---|---|
| Business case | Required outcome, numbered assumptions | Preferred option, assumptions marked tested | Committed budget, baselined numbers |
| Risk log | Top 5 ranked, each tied to an assumption and a test | Rescored after tests, new risks added | Residual ratings, delivery risks added |
| Experiment plan | Cheap tests on kill-level assumptions | Larger tests on what’s still open | Confirmation tests, launch metrics set |
| Gate decision | Fund the next tests, or stop | Choose the option, fund the build | Commit full resources and dates |
Keep depth proportionate: the Green Book wants “sufficient detail to support sound decision making,” and no more. A proposal’s effort should “correlate to its scale, cost, complexity and risk.”
NASA carries the same work products through reviews at rising maturity, and NPR 7123.1D tags them with labels such as Preliminary and Baseline.
A baselined product can still be maturing, since baselining “does not necessarily imply that it is fully mature at that point in the life cycle.”
So keep the core fields fixed across gates and tailor the depth. Reviewers then compare like with like.
When Templates Slow Gates Down Instead
Templates have a failure mode, and Stage-Gate’s own creator has recorded the complaints. They turn into bureaucracy when the fields stop feeding a decision.
Paperwork That Feeds No Decision
In a 2014 article, “What’s Next?: After Stage-Gate”, Robert Cooper lists critics’ complaints that the process is “loaded with paperwork, checklists, and too much non-value-added work.”
He also reports what leaner gates looked like at 2 companies:
- At J&J’s Ethicon Surgery group, business cases that had been “30–90-page documents that took weeks to prepare” came down to 4 pages.
- P&G’s SIMPL process cut its deliverables packages “to a mere six pages.”
Cooper cites sources from 2005 and 2007 for these, so treat them as illustrations. Neither measures how much faster the gates ran.
The definition he quotes is short: bureaucracy is “work that adds no value.” By that test, a field that never changes a decision is bureaucracy.
Ask of every field whether a reviewer would decide differently without it.
A Checklist on Paper Isn’t the Same as Using It
Surgery offers a useful analogy, with a caution attached. The WHO surgical safety checklist was introduced in 8 hospitals in 8 cities, with a before-and-after comparison.
Haynes and colleagues reported these results in 2009:
- Deaths fell from 1.5% to 0.8%.
- Complications fell from 11.0% to 7.0%.
Then Ontario encouraged adoption and required hospitals to report on it publicly. Urbach and colleagues studied 101 hospitals and found no significant drop in deaths or complications.
The 2009 study had no concurrent control group, and surgery isn’t a gate meeting. But read together, the pair is a useful caution.
Our reading: a template filled in only to satisfy a rule doesn’t change the conversation, and that’s where the decision gets made.
The Blank-Canvas Objection
Cooper also describes a more radical option, piloted at Corning, that drops template-driven deliverables. In his account:
- Each team “begins with a blank canvas” and maps its own.
- “No activities are done simply because they are ‘on a list’ in some manual, or deliverables prepared because there is a template to be completed.”
- The catch, which he’s candid about: “project teams must be very experienced to make this work.”
Our answer is that the template is that canvas, made repeatable. It holds Cooper’s critical assumptions and the evidence needed to test them, for teams that aren’t all experts.
P&G made a related call about process, as Cooper reports. Dietmar Bressau, its corporate leader for innovation diamond management, wanted one common process tailored to each initiative’s risk.
His warning: “When you open the door to two to three processes, then along comes four, five, and six. Ultimately, anything goes.”
So keep one linked set of templates and scale its depth to risk. After a few projects, delete any field that never changed a decision, portfolio-wide.
Link the Three Before You Polish Any of Them
A gate gets faster when its questions are answered ahead of the meeting, in a shape every reviewer recognizes. Linked IDs make that shape hold across gates.
Start with 4 moves, in this order:
- Number the assumptions in your current business case, A1 onward.
- Rank the risks that would kill the project, each tagged with an assumption ID.
- Write pass and stop thresholds for the riskiest assumptions before any test runs.
- Ask the next gate to review what moved, then commit or stop.
So don’t polish any single template first. A beautiful business case with unnumbered assumptions still sends the gate back to re-asking.
Tools make linked IDs easier to track from gate to gate. Someone still has to keep the assumptions current, though, and the gate still has to commit or stop.
And judge the gate by the quality of what it decides. A shorter meeting that funds the wrong project isn’t progress.
Download our free ebook Project Portfolio: From Opportunities to Value to learn how to run stage-gate decisions as part of a governed innovation portfolio.
Request a demo to see how Accept Mission gives you linked business cases, scorecards, and gate decisions in one view across your innovation portfolio.







 English
 Dutch
Dutch Portuguese
 Spanish
 French
 German
 Arabic