
Has Your Stage-Gate Process Outgrown Spreadsheets? 7 Signs14 min read

The spreadsheet worked fine for the first pilot. Now a gate meeting stalls because 2 people brought different copies.
Maybe you’ve already seen a few of these:
- A gatekeeper approves an idea by email, and the sheet never hears about it.
- Scoring weights shift between cycles, and nobody logs it.
- Someone asks how long ideas sit at gate 2, and the room goes quiet.
- Finance wants a portfolio view, so you spend Friday merging 4 department copies.
Notice that none of these is about idea volume or file size. The real trigger is when the sheet can’t answer the questions a gate depends on.
They sound basic: which version is current, who decided what, and on which evidence? And a shared sheet can’t always show whether the criteria changed along the way.
Still, gates with no criteria and no owner won’t improve in new software. So fix the discipline first, then use the 7 signs below to decide.
Why the Spreadsheet Worked, and When It Stops
To be fair, the spreadsheet earned its place:
- Cheap and familiar: you start with an interface your team already uses.
- Flexible: it lets you reshape the process every month while you’re still learning what a gate should ask.
- Right-sized: for 1 funnel, 1 owner, and a few dozen ideas, it’s a practical starting point.
But spreadsheets hide errors. Raymond Panko’s 2015 review of audit studies covered 85 spreadsheets in intensive inspections, mostly by commercial auditing firms.
He reports that those studies “found errors in 94% of the spreadsheets studied.”
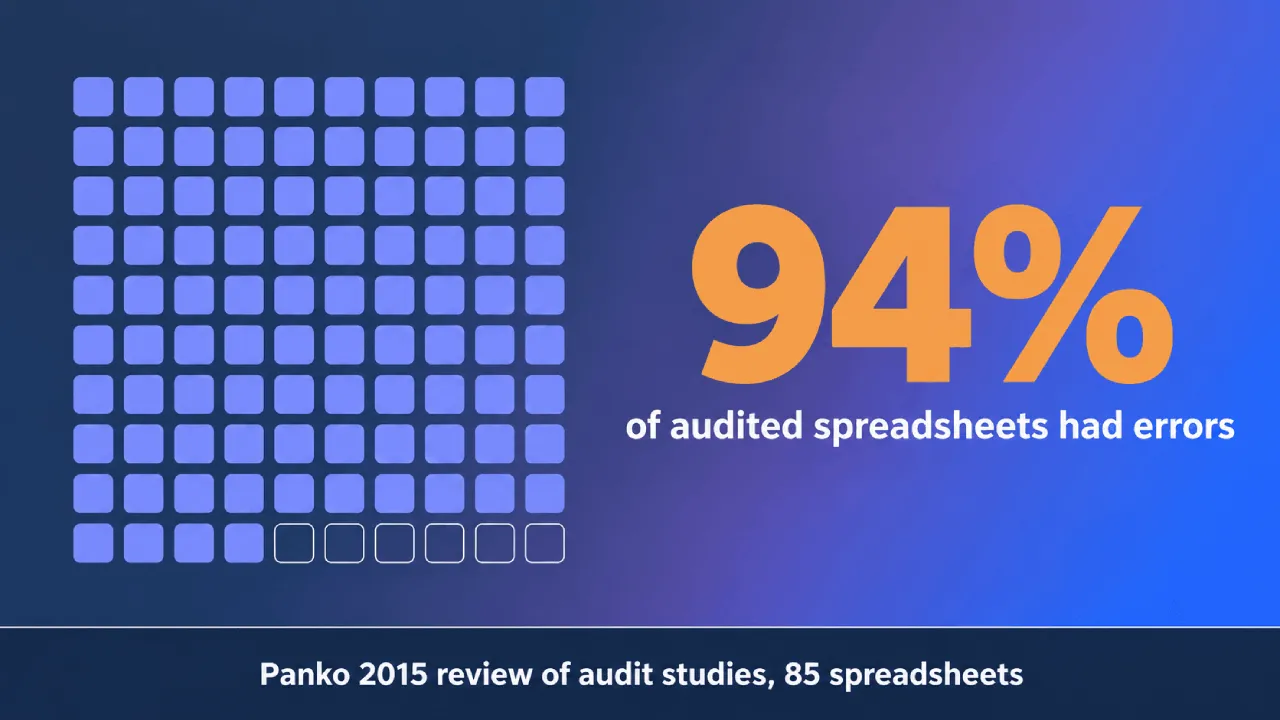
He’s also careful to say errors are rare per cell. His point: in large sheets, at least one wrong bottom-line value is very likely.
So each copied tab adds another version to check. And each decision based on that file raises the stakes of an undetected error.
A gate is exactly that kind of decision. The 7 signs below fall into 3 groups: the record, the flow between stages, and the portfolio.
The 7 Signs at a Glance
Start with the quick scan. Each sign points to a gate question the sheet no longer answers.
| Sign | What You’ll Notice | The Gate Question It Can’t Answer |
|---|---|---|
| 1. Version confusion (Record) | Files named “final_v3_JM” | Which version is current? |
| 2. Decisions in inboxes (Record) | Approvals sit in email threads | Who decided, when, and on what evidence? |
| 3. Untracked criteria changes (Record) | Weights shift between cycles | Were these ideas judged by the same rules? |
| 4. Invisible wait times (Flow) | No review-ready or gate decision dates | How long do ideas wait at each gate? |
| 5. Hidden reviewer disagreement (Flow) | Scores averaged across separate tabs | Did reviewers actually agree? |
| 6. Departmental copies (Portfolio) | Each unit keeps its own file | What does the whole portfolio look like? |
| 7. All-or-nothing sharing (Portfolio) | Sharing status means sharing scores | Who may see what? |
Every question in the right-hand column is one a gatekeeper should answer in under a minute. If the sheet makes that slow, the gate slows too.
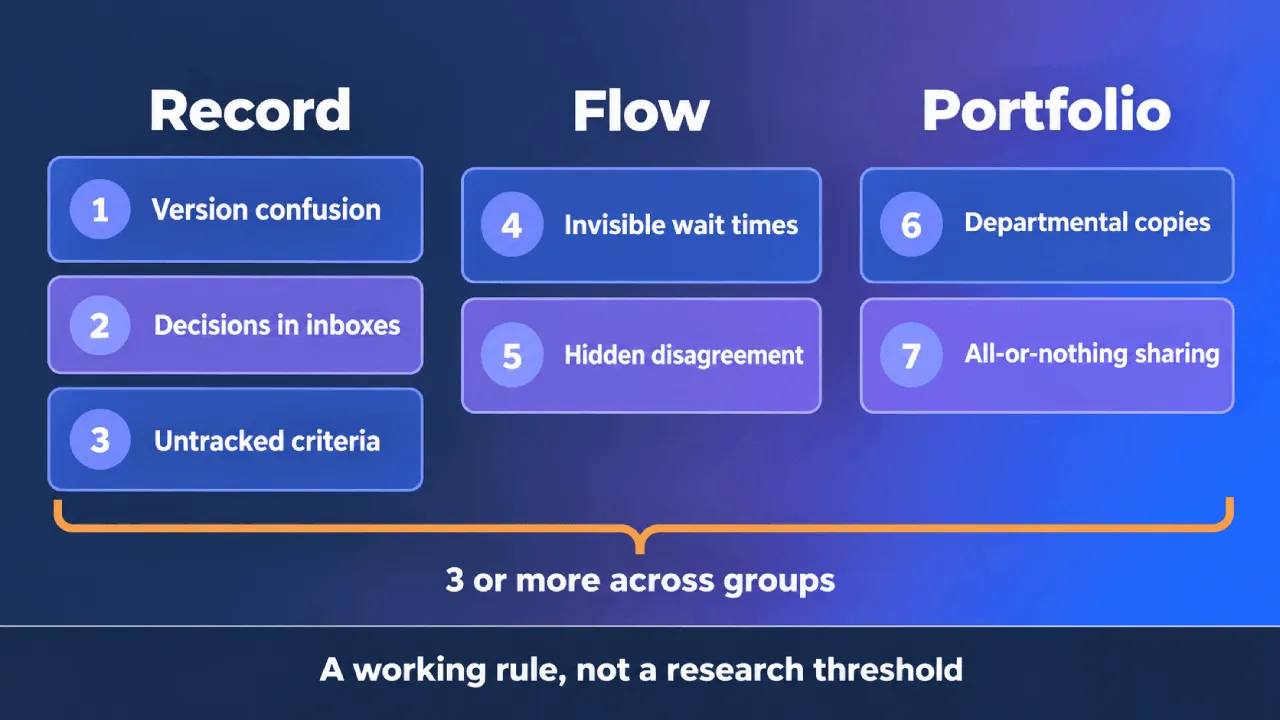
As a working rule, 1 or 2 familiar rows means fix the sheet. Three or more, especially across more than one group, means your process has outgrown it.
Signs in the Record Itself
The first 3 signs live inside the file. They’re about whether the gate’s record deserves any trust.
If a gatekeeper doubts the record, every decision made from it inherits that doubt.
Sign 1: Nobody’s Sure Which Version Is Current
You’ll see it in the file names first:
- “Gate2_final”
- “Gate2_final_v2”
- A copy with someone’s initials on the end
In a 2016 survey at ABB, 74% of 180 respondents said they typically keep 2 or more spreadsheet versions.
And 64% tracked versions with dates or numbers in file names. It’s self-reported and from one company, but it’ll sound familiar.
At a gate, the cost is concrete. Reviewers working from different versions are judging different drafts of the same idea.
Try a simple test this week. Ask 3 reviewers to send you the file they’d bring to the next gate, then compare them.
If the files differ, find out which one the last Go decision used. If nobody knows, that decision rests on a guess.
Sign 2: Gate Decisions Live in Inboxes, Not in the Record
The Go decision happened. It just happened in an email thread, a hallway, or a chat message the sheet never saw.
The US Department of Energy’s 2007 stage-gate guidelines list 4 possible gate decisions:
- Go Forward: funding approved for the next stage
- Stop: no funding for the next stage
- Hold: suspended, to be re-evaluated later
- Return: back to the previous stage to finish the work
Each outcome governs money or time. If the sheet only shows a status color, nobody can reconstruct who chose it or why.
US bank supervisors set a documentation bar for models in 2011. Newer guidance replaced it in April 2026, but the bar still makes a useful test.
The Federal Reserve’s 2011 model risk guidance said documentation should be “sufficiently detailed so that parties unfamiliar with a model can understand how the model operates.”
Apply that bar to gates: someone who missed the meeting should follow each decision from the file alone. Pick 3 from last quarter and test it.
If you’re digging through inboxes to do it, the record has gaps. Expect those gaps to reopen settled decisions when nobody remembers the rationale.
Sign 3: Criteria and Weights Change Without a Trace
Someone raised the weight on strategic fit last spring, and the trail ends there:
- Nobody logged the change.
- This cycle’s ideas now look stronger than last cycle’s.
- There’s no real reason for the jump.
In a survey published in 2011 of 38 US public companies, 74% of the 31 that answered had no documented procedure to track spreadsheet changes.
It’s a small financial-reporting sample, so treat it as a signal. Those companies were working on SOX compliance, and change tracking still often wasn’t documented.
When economists Herndon, Ash, and Pollin re-examined the Reinhart-Rogoff study in 2013, they found “coding errors, selective exclusion of available data, and unconventional weighting of summary statistics.”
Their workbook check exposed a coding error that dropped 5 countries. An unlogged weight change can hide the same way.
This week, compare the criteria tab against the one from 2 cycles ago. If you can’t explain each difference, your trend lines aren’t comparing like with like.
Signs in the Flow Between Stages
The next 2 signs show up between gates. They’re about time and judgment, which disappear when your sheet records only status and averages.
Your sheet records where an idea is. Showing how long it took to get there takes dated transitions, just as project-funnel tracking does.
Sign 4: You Can’t Say How Long Ideas Wait at Each Gate
Ask how long ideas wait at gate 2, and you’ll get a guess. The sheet shows each idea’s stage, but its time in the queue stays hidden.
Run 3 checks on your last 10 gate decisions:
- Find the date each idea entered its stage.
- Find when each idea was ready for review and when the gate decided.
- Count how many of those dates you had to rebuild from memory or email.
Stage entry to the gate decision includes active work and waiting. To isolate gate waiting, also record when the idea became ready for review.
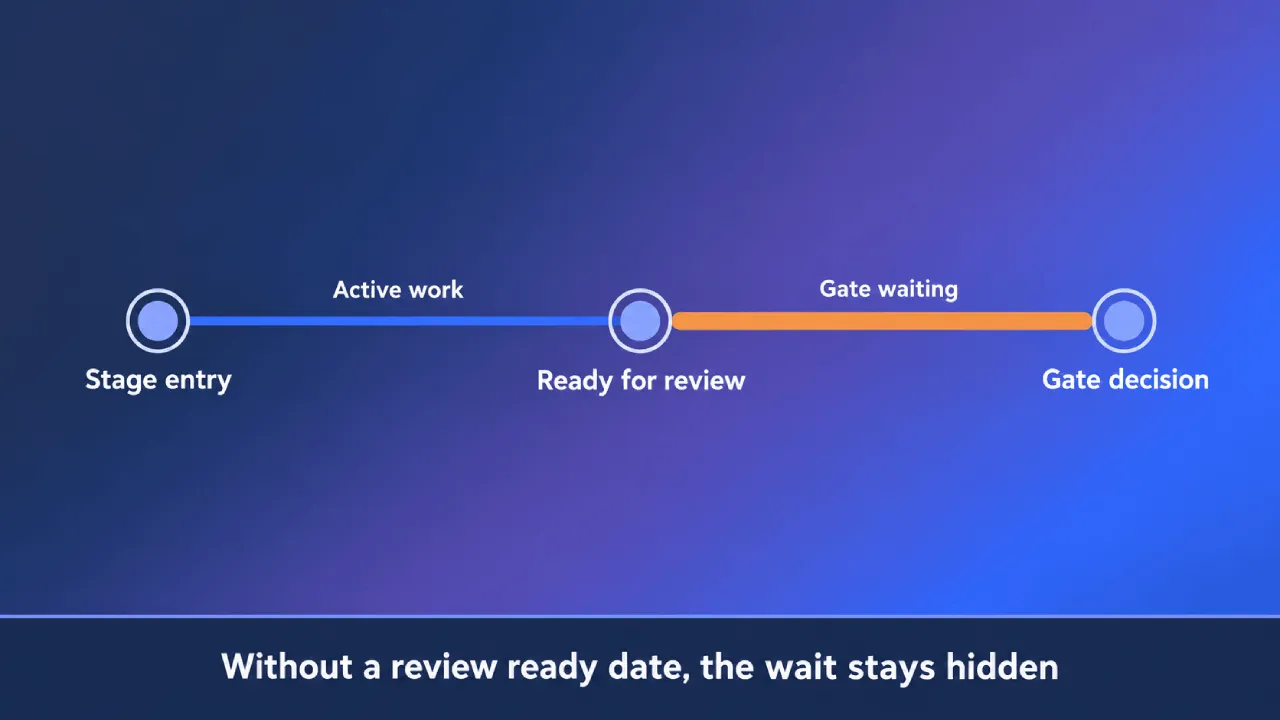
A 1995 Management Science paper modeled product development work as a queueing network.
“At any given time,” the authors wrote, “a job is either receiving service or queueing for access to a resource.”
In an idea funnel, ideas awaiting a gate decision form a queue. Your sheet needs both review-ready and decision dates to show that wait.
The same DOE guidelines want criteria clear enough that gatekeepers “can make objective and timely decisions.” Timely is hard to judge without dates.
Without wait times, you can’t see which gates stall, let alone why. So you’ll add reviewers when the real fix might be a decision deadline.
Sign 5: Reviewers Score in Separate Tabs, and the Average Hides the Disagreement
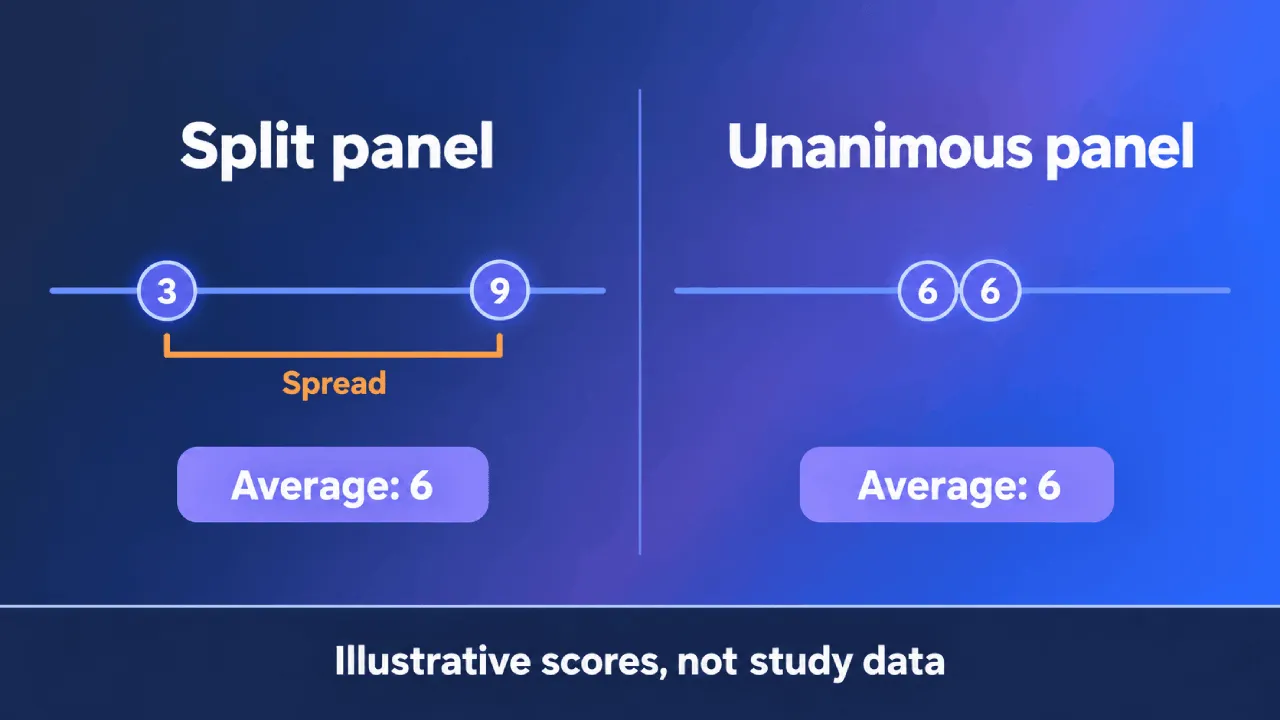
Each reviewer fills in a separate tab, and a summary sheet averages away the spread a gate should discuss. A split panel and a unanimous one look the same:
- Split panel: a 3 and a 9 average to 6.
- Unanimous panel: two 6s average to 6.
In a 2018 PNAS study, 43 reviewers rated a shared pool of 25 NIH oncology applications. The authors reported “no agreement among reviewers regarding the quality of the applications.”
It appeared, they wrote, that outcomes “depended more on the reviewer to whom the grant was assigned than the research proposed in the grant.”
But all 25 applications were eventually funded, so the pool was narrow and already strong. That limits what the result says about all submissions.
A 2021 paper analyzed NIH and American Institute of Biological Sciences data across full submission ranges. It found good agreement for averages of 3 reviewers.
Those inter-rater reliability estimates were 0.61 for NIH and 0.64 for the institute. Yet an average alone hides the spread you need to discuss at a gate.
Business judgment shows the same pattern, as Kahneman and colleagues argued in 2016: judgments vary “even when people are in the same role and supposedly following the same guidelines.”
At your next gate, collect every reviewer’s score before discussion and show the spread beside the average. Where it’s wide, the average has been making those calls for you.
Signs at the Portfolio Level
The last 2 signs grow with the audience: more teams running gates, more people asking. The questions shift from single ideas to the whole portfolio.
And portfolio questions need a single, consistent source.
Sign 6: Every Department Runs Its Own Copy
Every department started from the same template, and now each runs its own copy:
- R&D keeps one file.
- Operations keeps another.
- A regional team has quietly built a third.
Within a cycle or two, their columns and criteria will probably drift apart. Then you’ll start your portfolio review by reconciling those differences.
Higher-stakes teams hit the same wall. JPMorgan’s 2013 task force report on the London Whale losses describes a risk model run through manual spreadsheets.
Those sheets “had to be completed manually, by a process of copying and pasting data from one spreadsheet to another.”
The spreadsheet was 1 factor among many in those losses. But a roll-up built by hand from separate files repeats that same copy-and-paste step.
This week, ask each department for its current file and count the columns that don’t match. Each mismatch needs checking before the next portfolio review.
Sign 7: You Can’t Share Status Without Sharing Everything
A submitter asks where their idea stands. To answer, you’d have to share a sheet that also shows every reviewer’s score and comment.
Different people need different views:
- Submitters: status and next step
- Reviewers: their own scores until the gate meets
- Sponsors: decisions, rationale, and portfolio totals
- Executives: the roll-up across funnels
Access rules also went undocumented in that same survey. Of the 32 that answered, 23 had no documented procedure for setting user access levels.
Without separate views, expect teams to fall back on 1 of 2 bad options. They share everything, or they share nothing and answer status emails by hand.
Both cost you at the gate. Open scores give sponsors something to lobby over, and hidden status makes the funnel feel like a black box.
Try this: list everyone with access to the funnel file, and ask whether each needs the scores. Each “no” flags score access that person doesn’t need.
When the Spreadsheet Isn’t the Problem
Honestly, some of these signs have nothing to do with the spreadsheet. They come from gates that were never real decision points.
A 2017 McKinsey article warns that too often, stage-gate meetings are “little more than reviews of product maturity, with limited focus on decision making.”
The authors add that “funding is rarely delayed or halted at a traditional stage gate.” So participants have little reason to prepare for a real decision.
As Kahneman, Lovallo, and Sibony wrote in a 2011 HBR article, “A disciplined decision-making process, not individual genius, is the key to good strategy.”
Tools amplify clarity, but they won’t replace discipline. Clear gates get faster and more visible, and so do empty ones.
Tool Problem or Discipline Problem?
Read each symptom below twice, once for the tool and once for the discipline.
| Symptom | It’s the Tool If… | It’s the Discipline If… |
|---|---|---|
| Version confusion | Everyone follows the naming rule, and files still diverge | Nobody owns the master file |
| Slow gates | Decisions get made but take days to record and share | Nobody’s accountable for making the call |
| Ideas never get killed | Kill decisions get lost between copies | Gates have no criteria that could justify a Kill |
| Reviewer disagreement | Scores get collected, but the spread stays invisible | Reviewers were never told what the criteria mean |
| Weak portfolio view | Roll-up takes days of copying and pasting | Nobody’s agreed what the portfolio should balance |
If most of your answers land in the right-hand column, fix the gates before you shop.
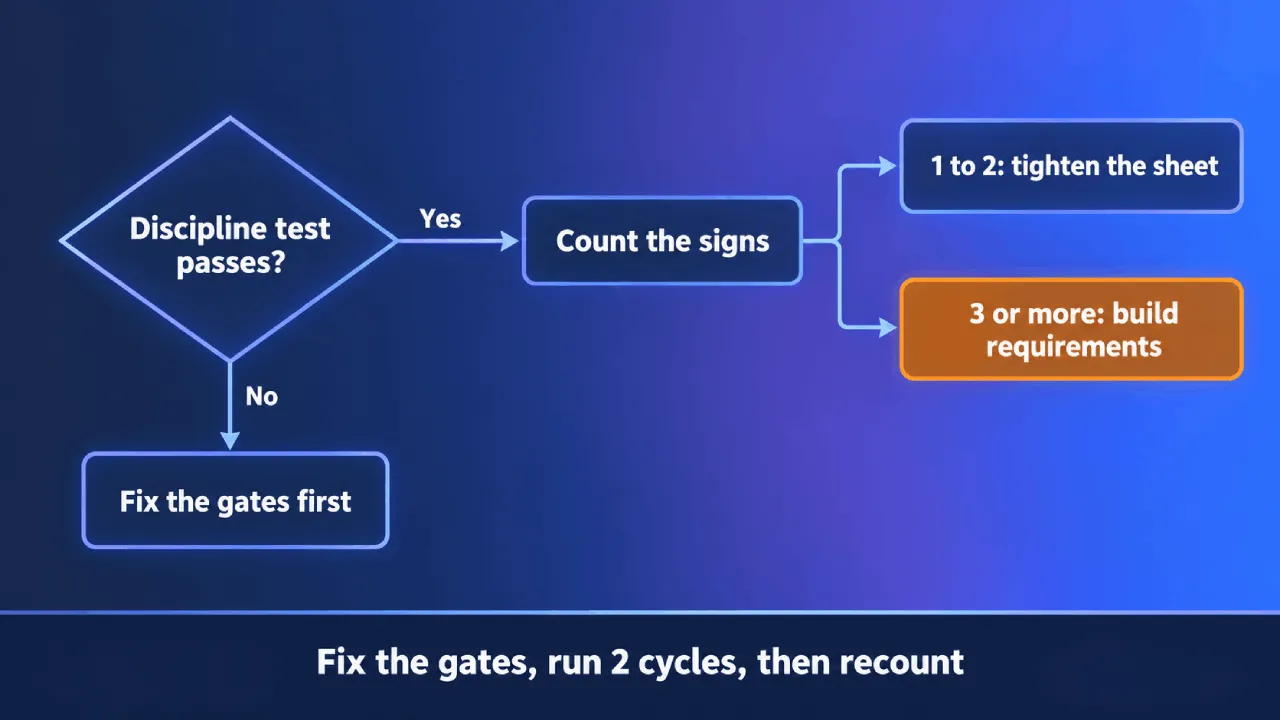
Give each gate written criteria, a named decision owner, and a real Kill option. Then run 2 cycles and see which signs remain.
The signs still standing after that are tool problems. They’re also your requirements list.
What to Require When You Move
Once the signs point at the tool, turn each one into a requirement. Keep the list generic, and judge every option against it.
Require these 7 capabilities:
- One live record per idea: its full stage history in one place, so there’s no “current version” to argue about.
- A decision log at each gate: the decision, owner, date, rationale, and evidence, attached to the gate itself.
- Versioned criteria: weights locked per cycle, with every change dated and visible.
- Stage timestamps: entry, review-ready, decision, and exit dates logged automatically, so stage duration and gate waiting are measurable.
- Independent scoring: reviewers score before discussion, and the spread shows beside the average.
- Portfolio roll-up: one view across funnels and departments, without copying files.
- Role-based visibility: submitters see status, reviewers see their own scores before discussion and the panel’s spread at the gate, and sponsors see decisions.
Items 1 to 3 cover the record, 4 and 5 cover the flow, and 6 and 7 cover the portfolio.
Next, plan the move itself. Migrate your criteria and open decisions first, and leave past cycles’ scores in an archive.
If your criteria changed, old scores aren’t directly comparable. Preserve their criteria, evidence, and decisions with them so the archive still explains each call.
Then run 1 funnel in parallel for a full cycle. Compare the gate meetings, and switch the rest once the new record answers all 7 gate questions.
Count the Signs Before You Count the Ideas
More ideas won’t help if your gates can’t decide well on the ones you have. So before anyone asks for more submissions, take an honest count of your gates.
Run these 4 tests this month:
- Record: Rebuild the rationale for 3 recent gate decisions from the file alone.
- Flow: Measure how long your last 10 ideas waited at each gate.
- Portfolio: Try to produce one status view for the whole portfolio in under an hour.
- Discipline: Check that each gate has written criteria, a named owner, and at least 1 Kill last year.
If the discipline test fails, start there, since software only amplifies what your gates already do. If it passes, use the other 3 tests to count the 7 signs.
Three or more signs, especially across groups, mean your stage-gate process has outgrown spreadsheets. With fewer than 3, tighten the sheet and recount next quarter.
If you’ve crossed that line, take the 7 requirements above into every vendor conversation. They’ll keep each comparison anchored to how your gates actually decide.
Download our ebook on idea evaluation and governance.
It covers structured pipelines, enrichment, scoring, governance frameworks, and the handoff from approved ideas into portfolio management.
Or book a demo to see how Accept Mission handles stage history, gate decision records, shared scorecards, and role-based visibility across funnels in one place.






 English
 Dutch
Dutch Portuguese
 Spanish
 French
 German
 Arabic