
Everything’s “High Priority” Again? How to Rebalance Workload vs Value13 min read

You re-ranked the portfolio last quarter, and it’s back again, nearly unchanged, with 30 initiatives marked high priority. Your delivery team can genuinely run 6 of them this quarter.
Here’s what a priority label charges the person who hands it out:
- To say it: no approval, no signature, no sign-off from anyone whose time it spends.
- To grant it: not one week of the one person the work actually depends on.
- To defend it next quarter: nothing, because the label survives without being re-argued.
- To withdraw it: a conversation nobody schedules, so the item quietly stays open.
Priority inflation is a budget failure. A ranked list has no ceiling, so value scores pile up while capacity stays fixed.
A rebalance works when the ranking spends a fixed amount of a named scarce resource and each item below the line gets an explicit decision.
The sections below weigh workload against value that way, from naming the one role you’re short of to the review that keeps the line in place.
Why Re-Ranking the Same List Produces the Same List
Re-ranking is a closed loop. The same people apply the same criteria to the same items and get the same answer.
Before blaming the criteria, have each person write the top 5 from memory and compare the lists. The research isn’t flattering.
Senior leaders can’t reliably name their own company’s priorities. 3 findings measure that from different angles:
- London Business School’s survey of 11,000 senior executives, leaders and managers across 400-plus companies found only a third could list their firm’s top 3 priorities.
- MIT Sloan’s research on strategy puts it lower: across 124 organizations, 28% of executives and middle managers responsible for executing strategy could list 3 of their company’s strategic priorities. Convergence on the same priority list drops off a cliff between the top team, at 51% agreement, and the senior executives reporting to it, at 22%.
- BCG’s 2024 survey of over 1,000 senior innovation executives found a record 83% rank innovation among their organization’s top 3 priorities, while just 3% of companies qualify as innovation ready on BCG’s maturity scoring, a steep drop from 20% in 2022. 52% of respondents named an unclear or overly broad strategy as one of their top 3 challenges.
Those numbers describe a list that means less the further it travels. A ranking nobody can reproduce from memory isn’t governing anything.
Tiering doesn’t fix this by itself. A tier inflates exactly the way a rank does when nothing caps how much fits inside it.
MoSCoW’s governing body puts a number on it: Must-Have effort shouldn’t exceed 60% of total effort, with roughly 20% held as Could-Have contingency.
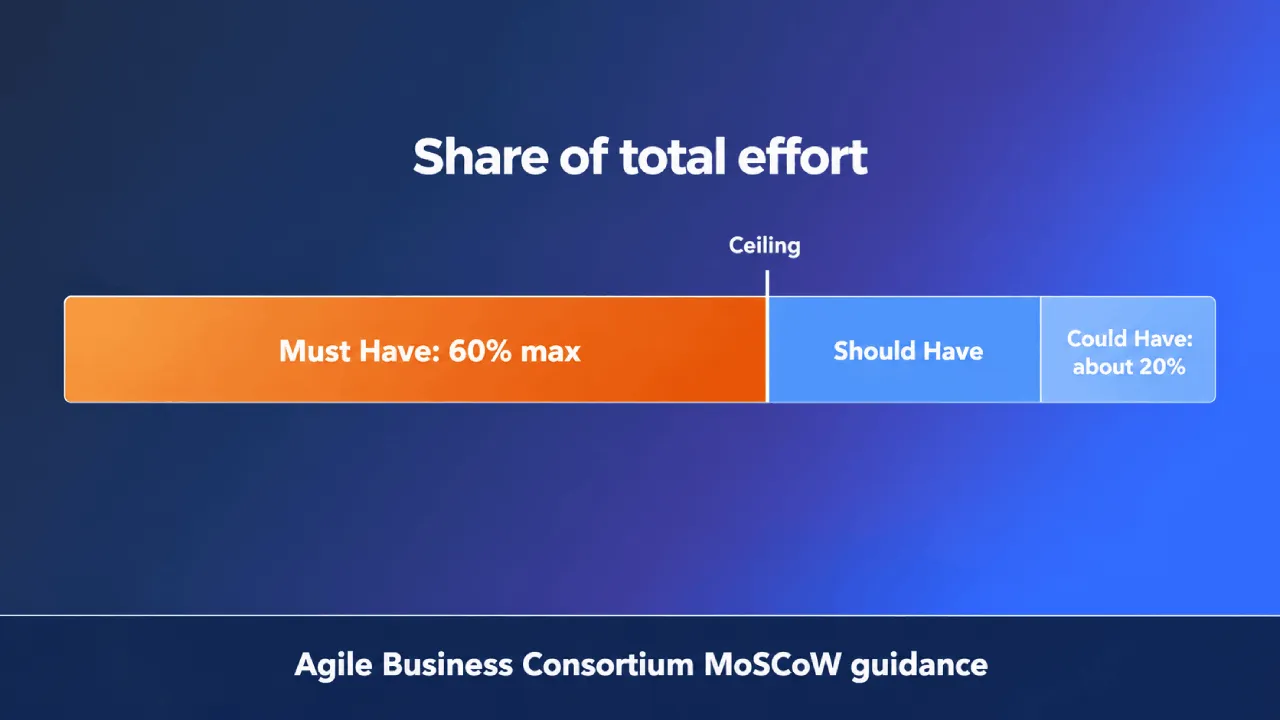
When everything is a Must Have, “the flexibility derived from the MoSCoW prioritisation would no longer work.” That ceiling does the job, so change what the ranking spends.
That’s what rebalancing workload against value means in practice. Workload is each initiative’s weeks on the scarce role, and value is its cost of delay per week.
Start by Naming the Constraint That’s Actually Scarce
Aggregate headcount won’t locate the constraint. Look for the 2 or 3 named roles everything routes through.
Pick the tightest of them to carry the budget, say the data engineer or the regulatory lead. The others become admission checks.
Count the weeks of that role each initiative needs, then total them: that’s your real workload. Expect the first pass to turn up far more than the period holds.
Utilization is where this gets unforgiving. Queueing theory puts the wait multipliers like this:
| Utilization | Relative wait time | What it means for the portfolio |
|---|---|---|
| 50% | 1x | Work moves at its natural pace and surprises get absorbed |
| 80% | 4x | The practical tipping point; delays start compounding |
| 90% | 9x | New requests queue behind work nobody scheduled |
| 99% | 99x | Nothing finishes on a date you’d commit to |
Past 80%, every initiative you admit buys delay for the ones already running. The queue charges it to everyone.
Reinertsen’s talk notes put the manufacturing benchmark at 85% utilization. The same notes observe that engineering work often gets loaded to 95%, and then nothing flows.
Those open hours on the calendar aren’t free capacity. Meetings and inbound requests have a prior claim.
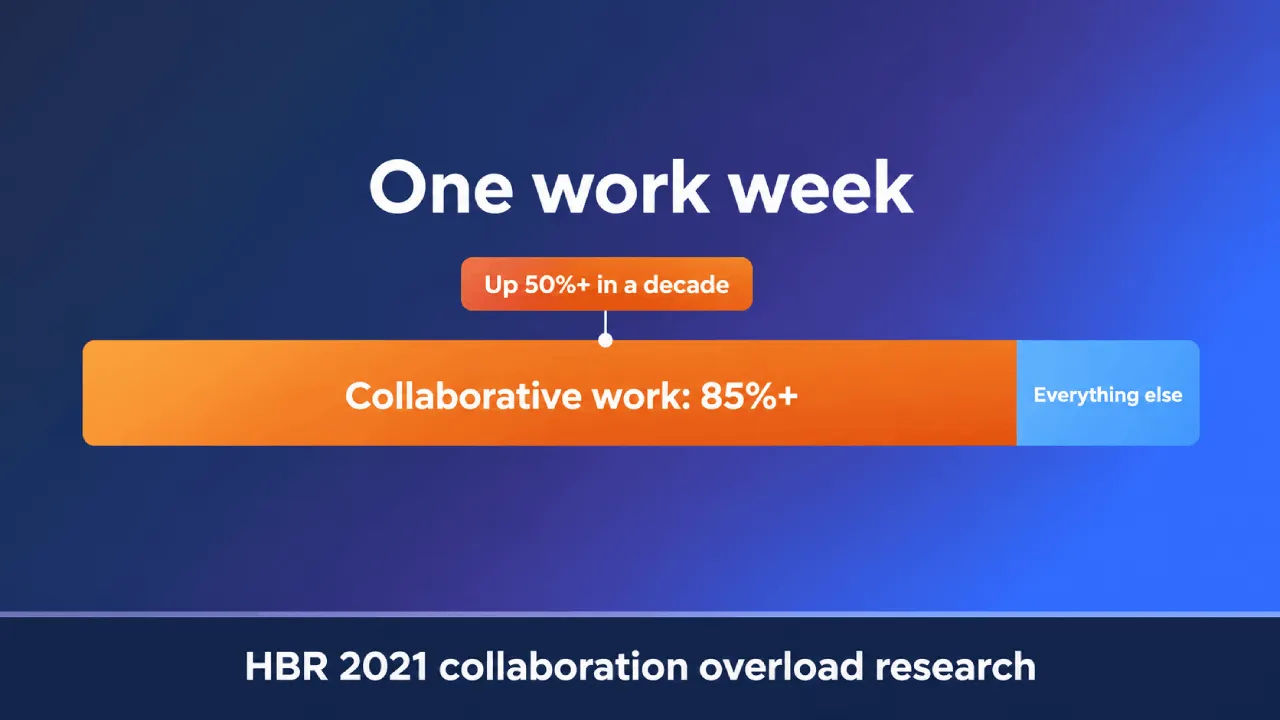
Collaborative overload research found collaborative work had risen by 50% or more over a decade. It consumed 85% or more of most people’s work weeks.
The University of California puts the return to an interrupted task at about 25.5 minutes. None of that time reaches your portfolio.
Score Value per Unit of the Constraint
Raw value scoring produces a list where everything scores well, because value has no natural denominator. Dividing by the constraint supplies one.
The question narrows fast. How much value does this deliver per week of the person you’re short of?
Unscoped items won’t give you a clean week count. Bracket them high and let the next review correct it.
Cost of Delay Separates Items That Look Identical
WSJF divides cost of delay by job duration. SAFe’s guidance opens with Reinertsen’s line: “If you only quantify one thing, quantify the Cost of Delay.”
Adapted to the scarce role, the formula does 3 jobs a raw value score can’t:
- It separates initiatives with identical value scores the moment you divide by how much of that role each one eats.
- It separates them again on timing: value tied to a regulatory or competitive window decays on a clock, while other value waits patiently.
- It “conveniently and automatically ignores sunk costs,” as the same page puts it, which in a rebalance is the entire point.
Now the honest part. Reinertsen’s notes report cost-of-delay estimates varying by roughly 50:1 across 10 stakeholders looking at the same item.
A practical house rule of ours: calibrate on 2 reference items before you trust a single score.
If the spread stays wider than 3x, treat the ranking as opinion.
The Precision Trap in Weighted Scores
A weighted score looks like arithmetic all the way down. It isn’t.
Cambridge’s guide to weighting and rating warns that the weightings and ratings “are subjective and arbitrary,” so the quantitative answer “too is subjective.”
Scoring still earns its keep. The spread is what’s worth inspecting, because a bunched list is a scoring failure.
| Scoring method | What it actually ranks | Where it fails |
|---|---|---|
| Raw value score | Appetite for the outcome | Nothing subtracts capacity, so the top bunches |
| Effort-adjusted score | Value per total person-week | Averages away the one role you’re short of |
| Cost of delay per constraint week | Value lost per week of the scarce role | Fails when no single role is the constraint, or when demand can’t be estimated before scoping |
The table argues for ranking against the thing you’re short of. More decimal places won’t help.
PMI’s AHP paper works through 6 projects where the top-ranked one takes 34.39% of relative contribution, roughly 2.6x the lowest.
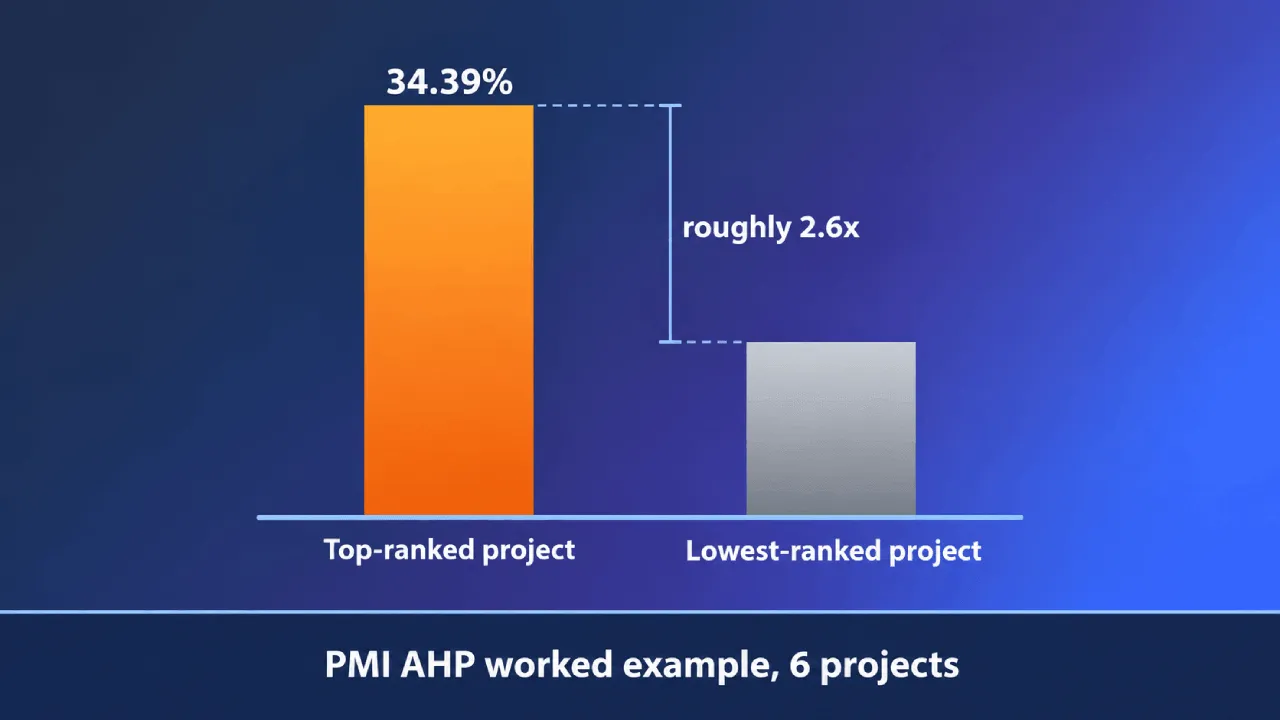
Vargas is candid about the limit: the consistency index validates the coherence of the judgments, never whether they’re right.
The Grundfos case is useful here. The pump manufacturer, roughly 18,000 people, reviews about 15 project proposals a month.
A customized 6-question tool, scoring opportunity and feasibility, replaced an externally sourced one they’d dropped. Scoring, reviewing and collating the results takes about 2 hours of total employee time.
Spend a Fixed Budget, Top Down, Until It’s Gone
Convert that role’s capacity for the period into one number, net of leave and standing commitments. Then budget 80% of that.
Walk the ranked list from the top, subtracting each initiative’s demand on that role. Stop when the budget reaches zero.
Everything past that point is below the line. The line is the whole mechanism, because it’s what finally makes a ranking cost something.
Here, 1 data engineer has 20 usable weeks in the half, so the budget is 16. Regulatory work tops the list because its value decays on a date:
| Initiative | Cost of delay per constraint week | Weeks of the data engineer | Cumulative weeks | Status against a 16-week budget |
|---|---|---|---|---|
| Regulatory reporting rebuild | 9.4 | 4 | 4 | Funded |
| Pricing data pipeline | 8.1 | 3 | 7 | Funded |
| Customer churn model | 7.6 | 6 | 13 | Funded |
| Partner API v2 | 6.2 | 3 | 16 | Funded, budget spent |
| Warehouse migration, phase one | 5.5 | 7 | 23 | Below the line |
| Self-serve reporting portal | 4.8 | 6 | 29 | Below the line |
| Internal search revamp | 3.9 | 4 | 33 | Below the line |
| Legacy dashboard consolidation | 2.7 | 8 | 41 | Below the line |
Read the cumulative column first. 41 weeks of demand against a 16-week budget is the portfolio’s real state.
Watch for the reflex to shave 20% off all 8 and stop none. It feels even-handed, and it delivers nothing sooner.
Partial funding is how a portfolio ends up with 8 things in flight and 0 of them finished.
A trimmed project still needs the same engineer, and it still has to clear the other admission checks. You removed scope; the demand on the constraint survived.
The 20% you held back absorbs everything nobody planned. Work that never reached the list will eat that engineer anyway.
Every Item Below the Line Gets a Decision
Silence below the line is a decision that nobody has to defend. It’s also why the same items reappear next quarter, unchanged.
PMI’s work on project termination put 482 participants in front of clear financial-failure signals, and 64% chose to continue against 36% who chose to stop.
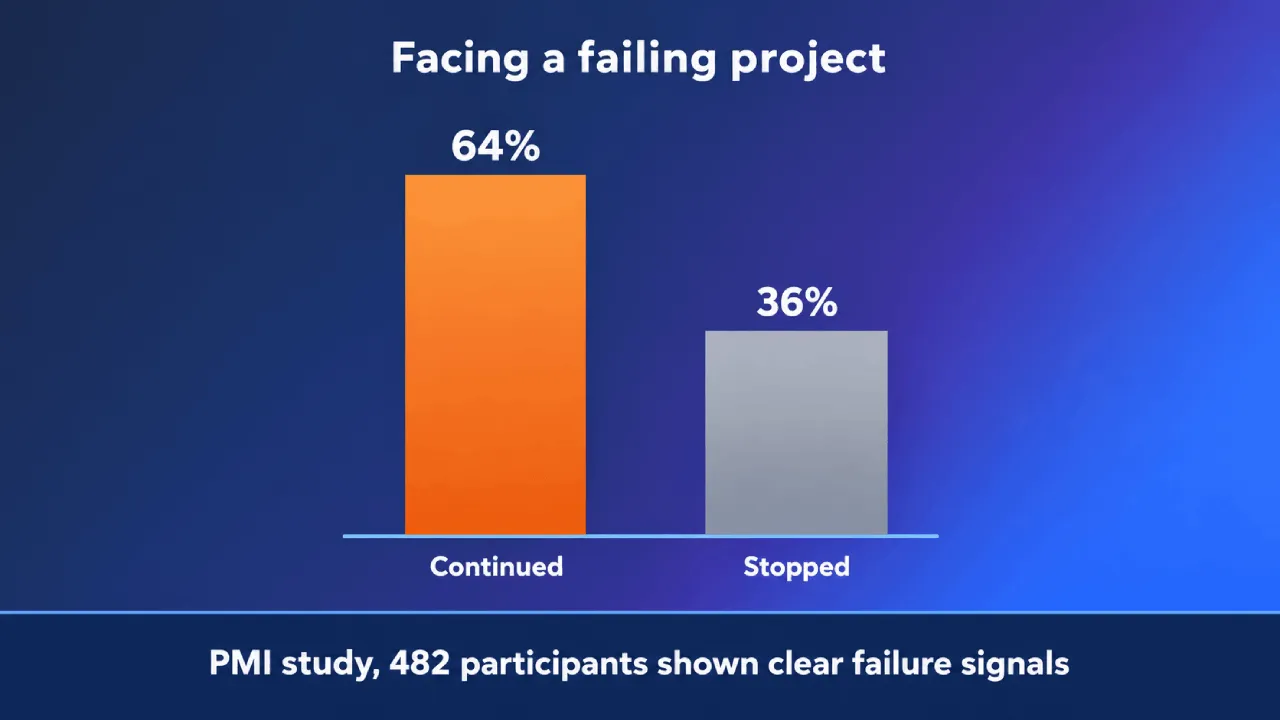
Optimism bias explains it, in 2 forms: in-project and post-project. An earlier PMI survey of 89 organizations found political agendas mattered more than the numbers.
In that data the CEO holds a veto right over stopping a project. Stop still needs that sign-off; the other 3 labels don’t, which is why they exist:
- Stop. Closed, written down, with the resources released and visibly reassigned somewhere else.
- Pause. Parked with a named restart trigger and a date, both owned by someone specific.
- Shrink. Funded only for the experiment that resolves the biggest unknown, and nothing past it.
- Hand off. Real work that belongs to a different budget, moved with the receiving sponsor’s agreement.
Having gates is a different thing from having a stop. Gates review without necessarily ending anything.
HBR’s research on killing projects examined a decade of Sony Ericsson’s product development and found conventional stage-gate reviews can themselves impede discontinuation.
Build the ending in at the start. One pattern is a sunset clause: annual reauthorization, or the initiative closes on schedule.
A 2025 HBR piece argues for time-boxing initiatives to a fixed duration. It also argues for rewarding the leaders who free resources by stopping work.
Say the cost out loud. A stop costs you a sponsor who stops attending, and a budget line finance takes back.
What the Line Costs You Politically
The line creates losers in a room where everyone has a sponsor. Plan for that before the meeting.
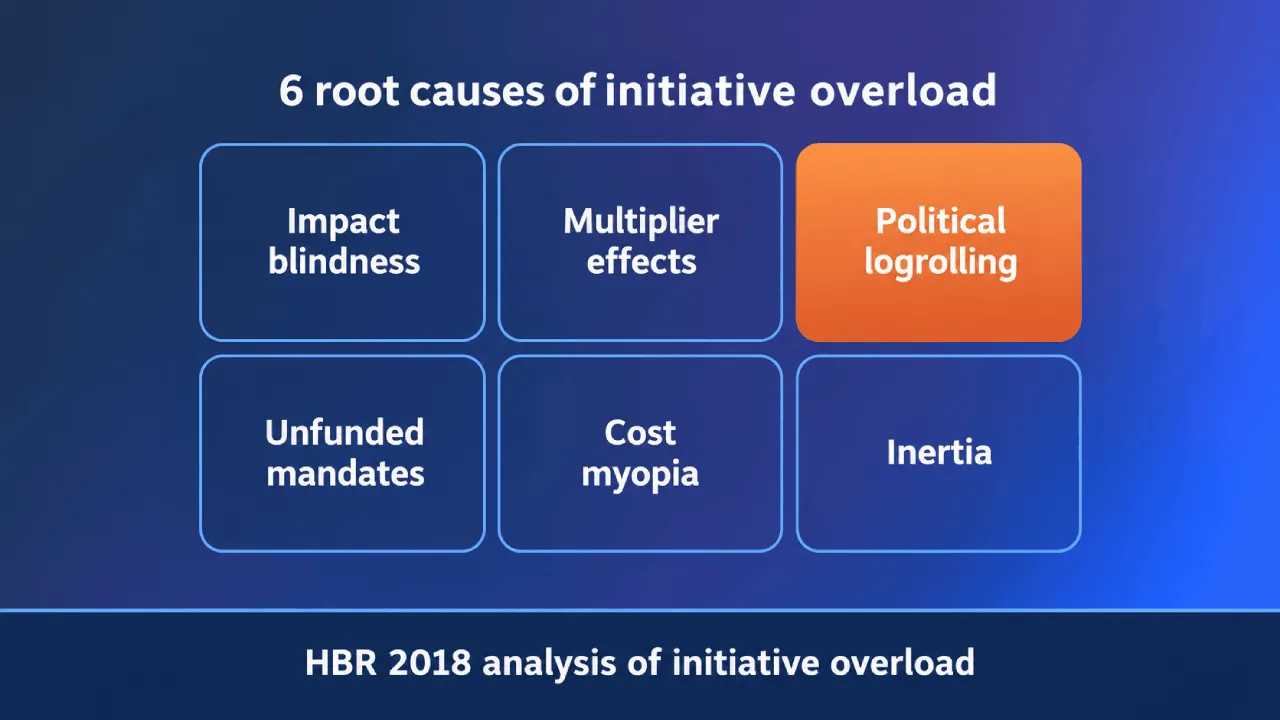
The 2018 HBR analysis of initiative overload names political logrolling, where sponsors trade support for each other’s projects, as 1 of its 6 root causes.
A hard line wounds people in ways the spreadsheet doesn’t record. Research on people-ranking makes the point by analogy:
- A 2025 Management Science study tracked a roughly 7,000-employee pharmaceutical multinational with a hard 20% cap on its top performance tier.
- Employees nominated for that tier and then denied it were at least a third more likely to leave voluntarily within 18 months.
- Their exit rate was comparable to that of actual poor performers.
- The study points at wounded self-image rather than pay.
The analogy has a limit: a denied person is the asset, a stopped project isn’t. Rank the work, and publish the constraint so the line reads as arithmetic.
You’ll still lose some goodwill, and the line is still correct. The alternative loses the same people slowly, to a queue that never clears.
Publish the criteria, the weights and the budget before the review, never after it. At Grundfos the reported benefit was buy-in, alongside the speed.
The department head there credited the tool’s anchoring statements with making discussions “much more concrete.”
MIT Sloan on escalation puts it plainly: managers “frequently continue pouring in more resources.” A published constraint makes that harder to do quietly.
Put the Rebalance in the Calendar
A rebalance triggered by a crisis is a rebalance run by whoever shouted loudest. Put it on the calendar quarterly and let it be boring.
McKinsey’s work on reallocation found a company that actively reallocates delivers, on average, a 10% return to shareholders, against 6% for a sluggish reallocator.
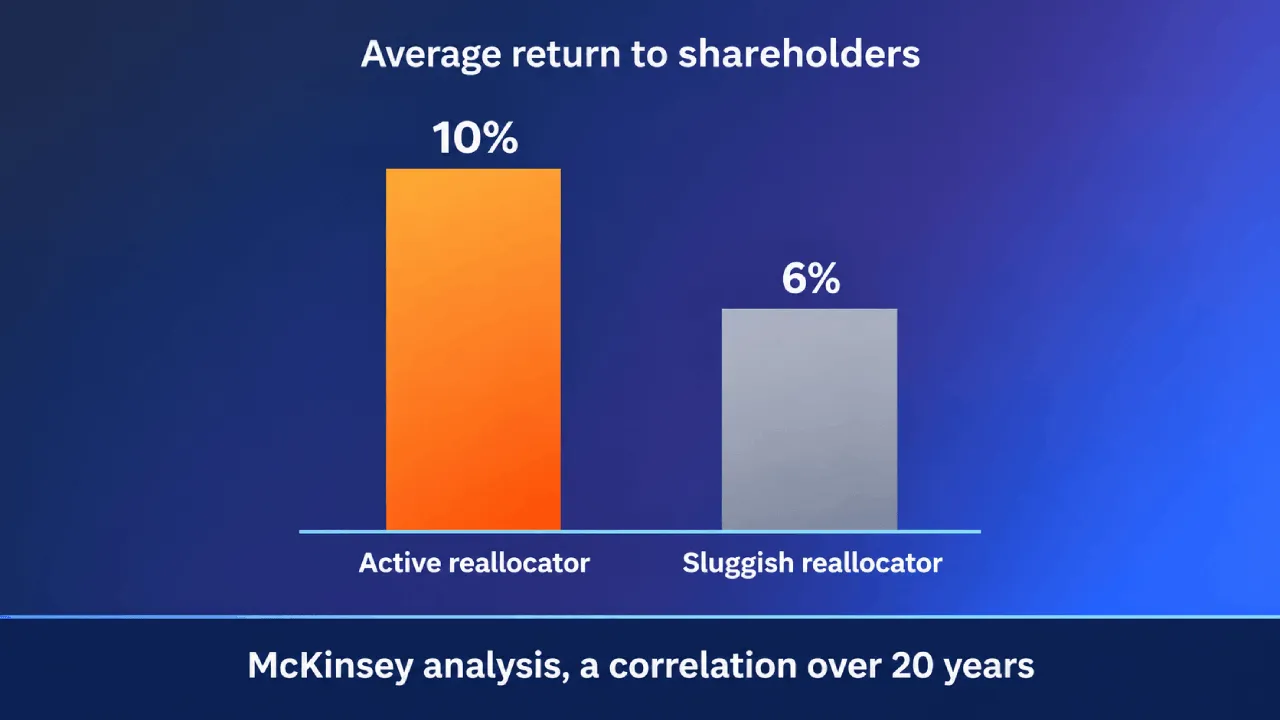
Over 20 years, the active reallocator ends up worth roughly twice as much. A fixed cadence is how you stay one, with a clear rule for what moves:
- Moves between reviews: the budget, the line and the labels underneath it.
- Holds: the criteria and the weights. Renegotiating them mid-cycle turns the ranking into an opinion, because the losing items always have an argument for a different weight.
One more design detail, from the same PMI survey of 89 organizations. Projects that had just started were more likely to be stopped than projects far along.
The data supported a completion effect more strongly than pure sunk cost. Build the review to put late-stage items on the table deliberately.
Left alone, expect the review to skip them, while the constrained role stays booked by work whose main qualification is that it started early.
Somewhere in the portfolio are 1 or 2 late-stage items nobody would start today. Those are what the scheduled review is for.
That’s how the next “everything’s high priority” quarter stops being a crisis. The list still comes back long, but the line’s already waiting for it.
Draw the Line Before the Quarter Draws It for You
Nothing on the list gets cheaper by waiting. The quarter will draw a line for you, through whatever slipped.
You already have the ranked list, and the rest is 5 moves, in order:
- Name the scarce role, and convert its capacity for the period into weeks.
- Rescore the list as cost of delay per week of that role, after calibrating the group on 2 reference items.
- Budget 80% of those weeks, spend them top down, and draw the line where they run out.
- Give every item under the line a Stop, Pause, Shrink or Hand-off label with an owner’s name.
- Book the next review now, with late-stage items on the agenda and the criteria locked.
This is where software earns its place. Accept Mission reports that data-driven scoring and group decision-making can deliver roughly a 30% reduction in resource waste.
Its AI assistants accelerate scoring and evaluation. The decision stays with the people who’ll answer for it.
A tool won’t hold the line for you. Draw it this quarter, and publish the arithmetic before anyone starts arguing about the items.
Download our free ebook Project Portfolio: From Opportunities to Value to learn how to prioritize an over-committed portfolio. It covers portfolio structure and stage-gate governance.
Or request a demo to see how Accept Mission gives you a single view of committed capacity and the scored decisions behind every funded initiative.







 English
 Dutch
Dutch Portuguese
 Spanish
 French
 German
 Arabic