
Prioritization Matrix vs Scorecard: One Filters, One Decides9 min read

The funnel just delivered forty ideas. The review board meets Friday, and everyone defines “best” differently.
The room usually splits four ways:
- Teams that plot every idea on a two-axis grid
- Teams that score all forty against weighted criteria
- Teams that switch methods the moment a ranking surprises them
- Teams that never write the criteria down
The first two are real methods, and they answer different questions. A matrix shows where ideas sit on two dimensions; a scorecard shows how each performs against criteria.
The other two are symptoms of picking without a rule. Early in the funnel you’re cutting volume; at the gate you’re committing resources.
The rule is simple: use the prioritization matrix to filter, use the scorecard to decide.
What a Prioritization Matrix Actually Does
A prioritization matrix sorts options on a small fixed set of dimensions, usually two. Some writers use the term for weighted criteria grids as well.
This piece means the unweighted kind. Two axes and four quadrants is the common shape, and the classic pair is impact against effort.
Eisenhower once quoted a college president on “two kinds of problems, the urgent and the important,” and the grid named after him still sorts work that way.
| Matrix variant | Axes or logic | Typical use |
|---|---|---|
| Impact/effort grid | Strategic value vs resources needed | First cut through a large idea set |
| Urgent/important grid | Urgency vs importance | Sorting daily work under deadline pressure |
| Pugh selection matrix | +, -, or S against a datum concept | Comparing options on many criteria |
Stuart Pugh’s controlled convergence stretches this into a multi-criteria grid, marking concepts better, worse, or the same against a datum. The marks stay qualitative, which suits early comparison.
Use the grid for what it’s good at, which is fast triage. It cuts a large set to a discussable shortlist in one session.
Coarseness is a feature here, not a flaw, because early estimates are rough anyway. A finer tool would only fake precision the data doesn’t have.
The grid also makes disagreement visible, and that’s still filtering. When reviewers split on an idea’s quadrant, that’s the conversation worth having.
Each variant trades precision for speed, so none of them gives you a number you can defend in a budget meeting.
The Matrix in Practice: Forty Ideas to Ten
Here’s a typical first pass:
Forty ideas sit in the funnel, plotted on an impact/effort grid where impact means strategic value and effort means people and budget. Every idea gets one dot.
One session sorts the forty into four piles:
- Ten high-impact, low-effort ideas, which is the shortlist to discuss
- High-impact ideas that need heavy resources, saved for a separate conversation
- Low-impact, low-effort work that fills gaps when there’s slack
- Low-impact work that needs real budget, which gets dropped
The grid did its job in one session, and nobody filled in a form. That’s the whole appeal.
The limits show up fast. Two axes can’t hold a real decision, and “high impact” means different things to different reviewers.

Nothing records how the judgment was made. If the decision commits budget, the quadrant answer won’t hold up.
Notice what the grid did and didn’t do. It cut forty ideas to ten and left them unranked, which is where the scorecard earns its place.
What a Weighted Scorecard Actually Does
A scorecard scores every idea against a fixed set of criteria. Each criterion carries a weight, and the total sums every score times its weight.
The Institute for Manufacturing at Cambridge describes the mechanics plainly. Assign weightings so relative merits count, then multiply each score by its weighting and sum the totals.
Setup is the price of admission:
- Write each criterion specifically
- Cap the set at five or seven criteria, not twelve
- Lock the weights before a single score exists
Anchor descriptions help too. A 3 on strategic fit should mean the same thing to every reviewer, and examples make that true.
Some teams swap the weights for a fixed formula. RICE, from product management, multiplies reach, impact, and confidence, then divides by effort.

The weighting and rating guide adds an honest caveat. Weights and ratings are subjective, so the quantitative answer inherits that subjectivity.
So use the scorecard for what it’s good at: the decision itself. This is the tool for the moment budget and people get committed.
What you buy is defensibility. Scores trace back to criteria and reviewers, so the ranking survives a challenge.
The Scorecard in Practice: Three Ideas at the Gate
Three ideas reach the gate, and the board wants a ranking it can defend. Scores run 1 to 5, higher is better.
| Criterion | Weight | Idea A | Idea B | Idea C |
|---|---|---|---|---|
| Strategic fit | 30% | 5 | 3 | 4 |
| Feasibility | 25% | 3 | 5 | 2 |
| Market potential | 20% | 4 | 4 | 5 |
| Speed to value | 15% | 2 | 4 | 3 |
| Resource efficiency | 10% | 3 | 4 | 2 |
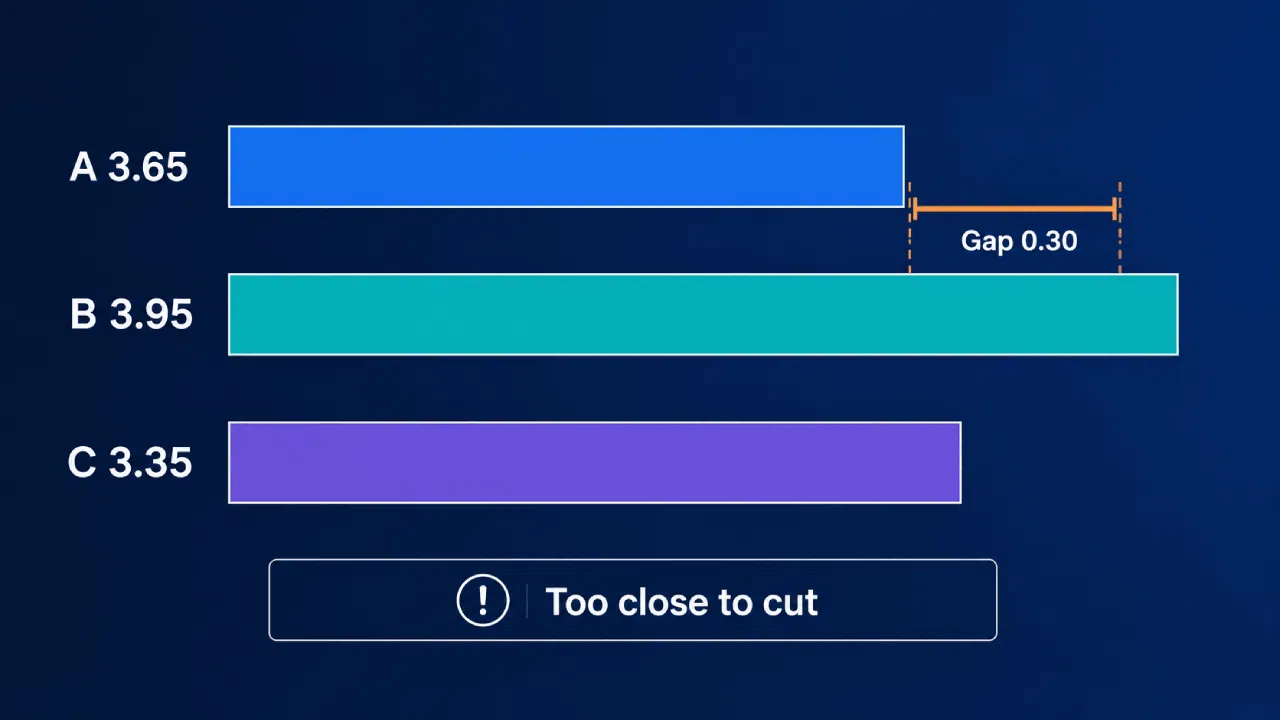
| Weighted total | 100% | 3.65 | 3.95 | 3.35 |
B wins on balance at 3.95, against 3.65 for A and 3.35 for C.
A’s top strategic fit can’t offset weaker scores elsewhere, and feasibility costs it the most. C leads on market potential and scores lowest on feasibility.
Read the gaps, not just the order. B leads by 0.30 here, close enough to deserve a conversation rather than a cutoff.
Anyone can challenge a specific score, so the number doesn’t end the debate. It makes the debate specific.
Setup costs an hour, and the same scorecard handles the next batch. Score first, discuss after, and peer anchoring stays out of the room.
Where Each Method Fails
Each method fails where the other one shines.
A two-axis grid can’t capture the trade-offs a real decision involves. A scorecard is overkill for a hundred early ideas.
| Prioritization matrix | Weighted scorecard | |
|---|---|---|
| Best at | Cutting volume fast | Ranking a shortlist defensibly |
| Time to run | One session | A full review cycle |
| Output | Quadrants or +/- totals | Weighted totals per idea |
| Defensibility | Low | High, when criteria were locked early |
| Fails when | The decision commits real resources | The set is too large for careful scoring |
Real decisions pursue several objectives at once, which forces trade-offs. A two-axis grid hides most of them, and the scorecard puts them on the table.
The scorecard has its own failure mode. Weights invite politics, and a ranking that surprises the room gets blamed on the method.
Watch the false precision too. A 3.65 and a 3.60 look like a verdict, and the gap may be one reviewer’s interpretation.

The matrix hides scale too, since two ideas in one quadrant can need very different budgets. Neither method removes judgment, and both make it visible, which is the point.
When to Filter, When to Decide
Here’s the rule – the matrix filters, and the scorecard decides.
Three tests cover most of the cases:
- More than ten ideas and one session to cut them: matrix
- Rough estimates, no agreed criteria, nothing committed yet: matrix
- Ten or fewer ideas, with budget and people on the line: scorecard
Start where the pain is. If a hundred ideas sit at intake, run a matrix this week.
If gate decisions keep getting re-fought, build a scorecard instead. The matrix’s axes carry over as criteria, joined by whatever else the gate needs.

One logic then runs from intake to gate. This is where software earns its place, keeping the scoring history that spreadsheets lose.
AI support can surface where reviewers diverge, which turns a dispute into a calibration conversation. The human stays in charge.
One rule keeps either method honest: no rewriting the rules midway. A method changed after the scores land produces a ranking nobody trusts.
Filter With the Matrix, Decide With the Scorecard
Two habits carry the whole system. Match the method to the decision, and write the criteria and weights before any idea is scored.
The next cycle needs three moves:
- Count what’s actually in the funnel first
- Write the criteria down where the whole board can see them
- Run the matrix, then the scorecard, and don’t change either once scores land
Teams that do this stop re-arguing the method at every gate. The discussion moves to the ideas, where it belongs.
The two habits are cheap, and they compound. A few cycles in, the group is better calibrated and the ranking easier to accept.
Download our free ebook on idea management to see how scoring and prioritization fit into a transparent funnel, from first idea to decision.
Or book a demo to see how scoring and gate decisions work on your own ideas.











 English
 Dutch
Dutch Portuguese
 Spanish
 French
 German
 Arabic